Fig. B.3
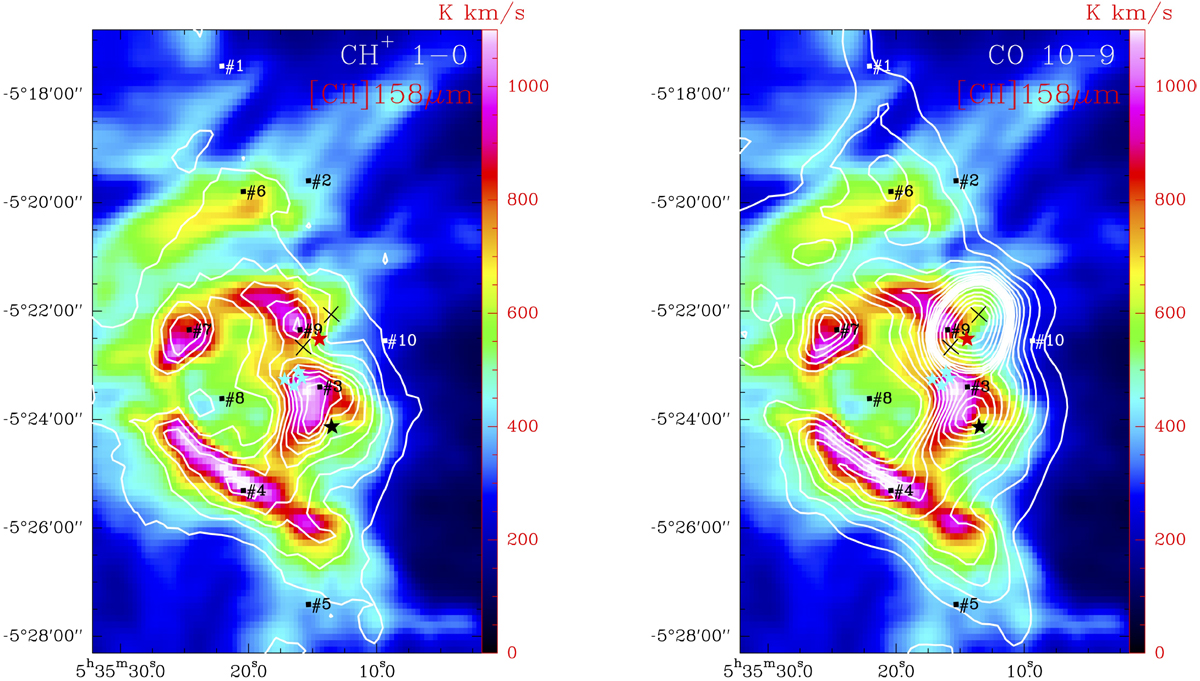
Integrated line emission from [C II] 158 μm (in color scale; Goicoechea et al. 2015a), CH+ J = 1–0, and CO J = 10–9 in white contours. Contours go from 5 to 45 K km s−1 in steps of 5 K km s−1 for CH+, and from 50 to 600 K km s−1 in steps of 50 K km s−1 and 700–1600 K km s−1 in steps of 200 K km s−1 for CO. Maps have been convolved to the same angular resolution (27′′).
Current usage metrics show cumulative count of Article Views (full-text article views including HTML views, PDF and ePub downloads, according to the available data) and Abstracts Views on Vision4Press platform.
Data correspond to usage on the plateform after 2015. The current usage metrics is available 48-96 hours after online publication and is updated daily on week days.
Initial download of the metrics may take a while.