Free Access
Fig. 11
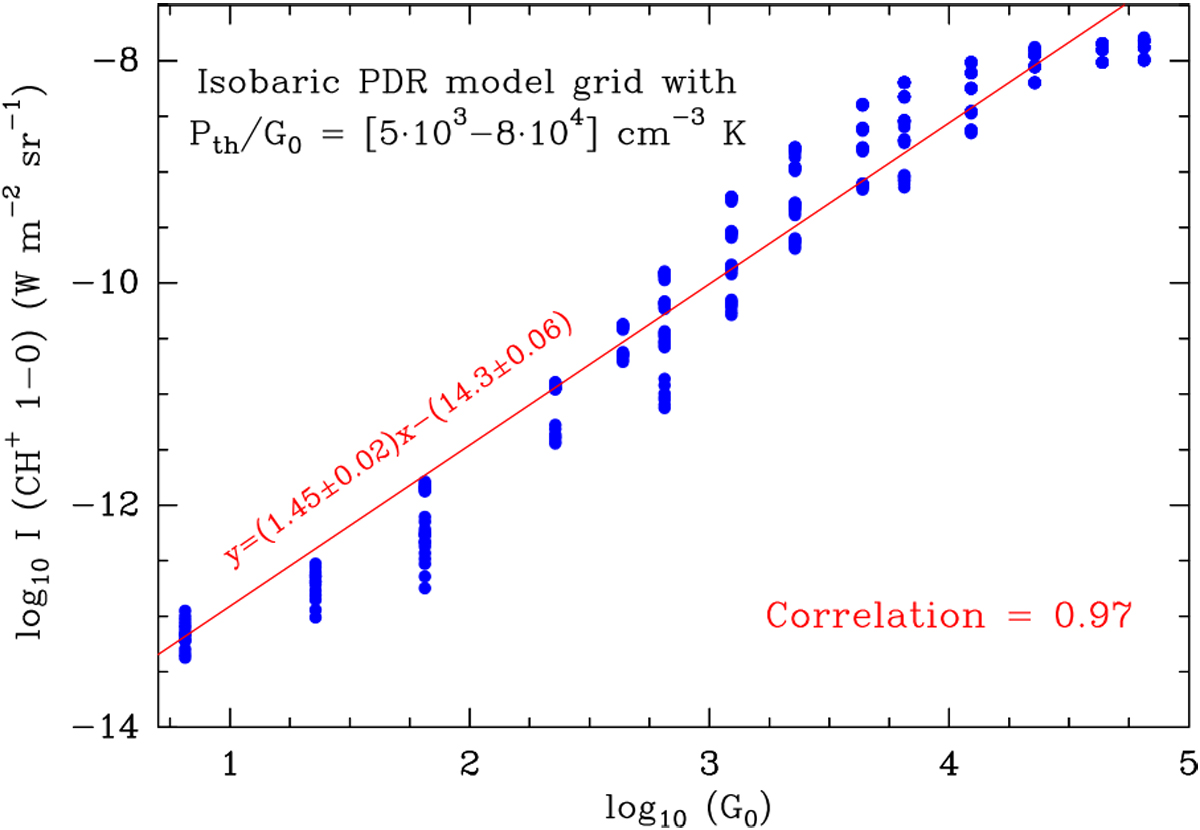
Results from a grid of isobaric PDR models with the Pth/G0 ratio ranging from 5 × 10³ to 8 × 104 cm−3 K (see text). The plot shows a correlation between incident FUV flux, G0, and CH+ (J = 1–0) intensity.
Current usage metrics show cumulative count of Article Views (full-text article views including HTML views, PDF and ePub downloads, according to the available data) and Abstracts Views on Vision4Press platform.
Data correspond to usage on the plateform after 2015. The current usage metrics is available 48-96 hours after online publication and is updated daily on week days.
Initial download of the metrics may take a while.