Fig. 10
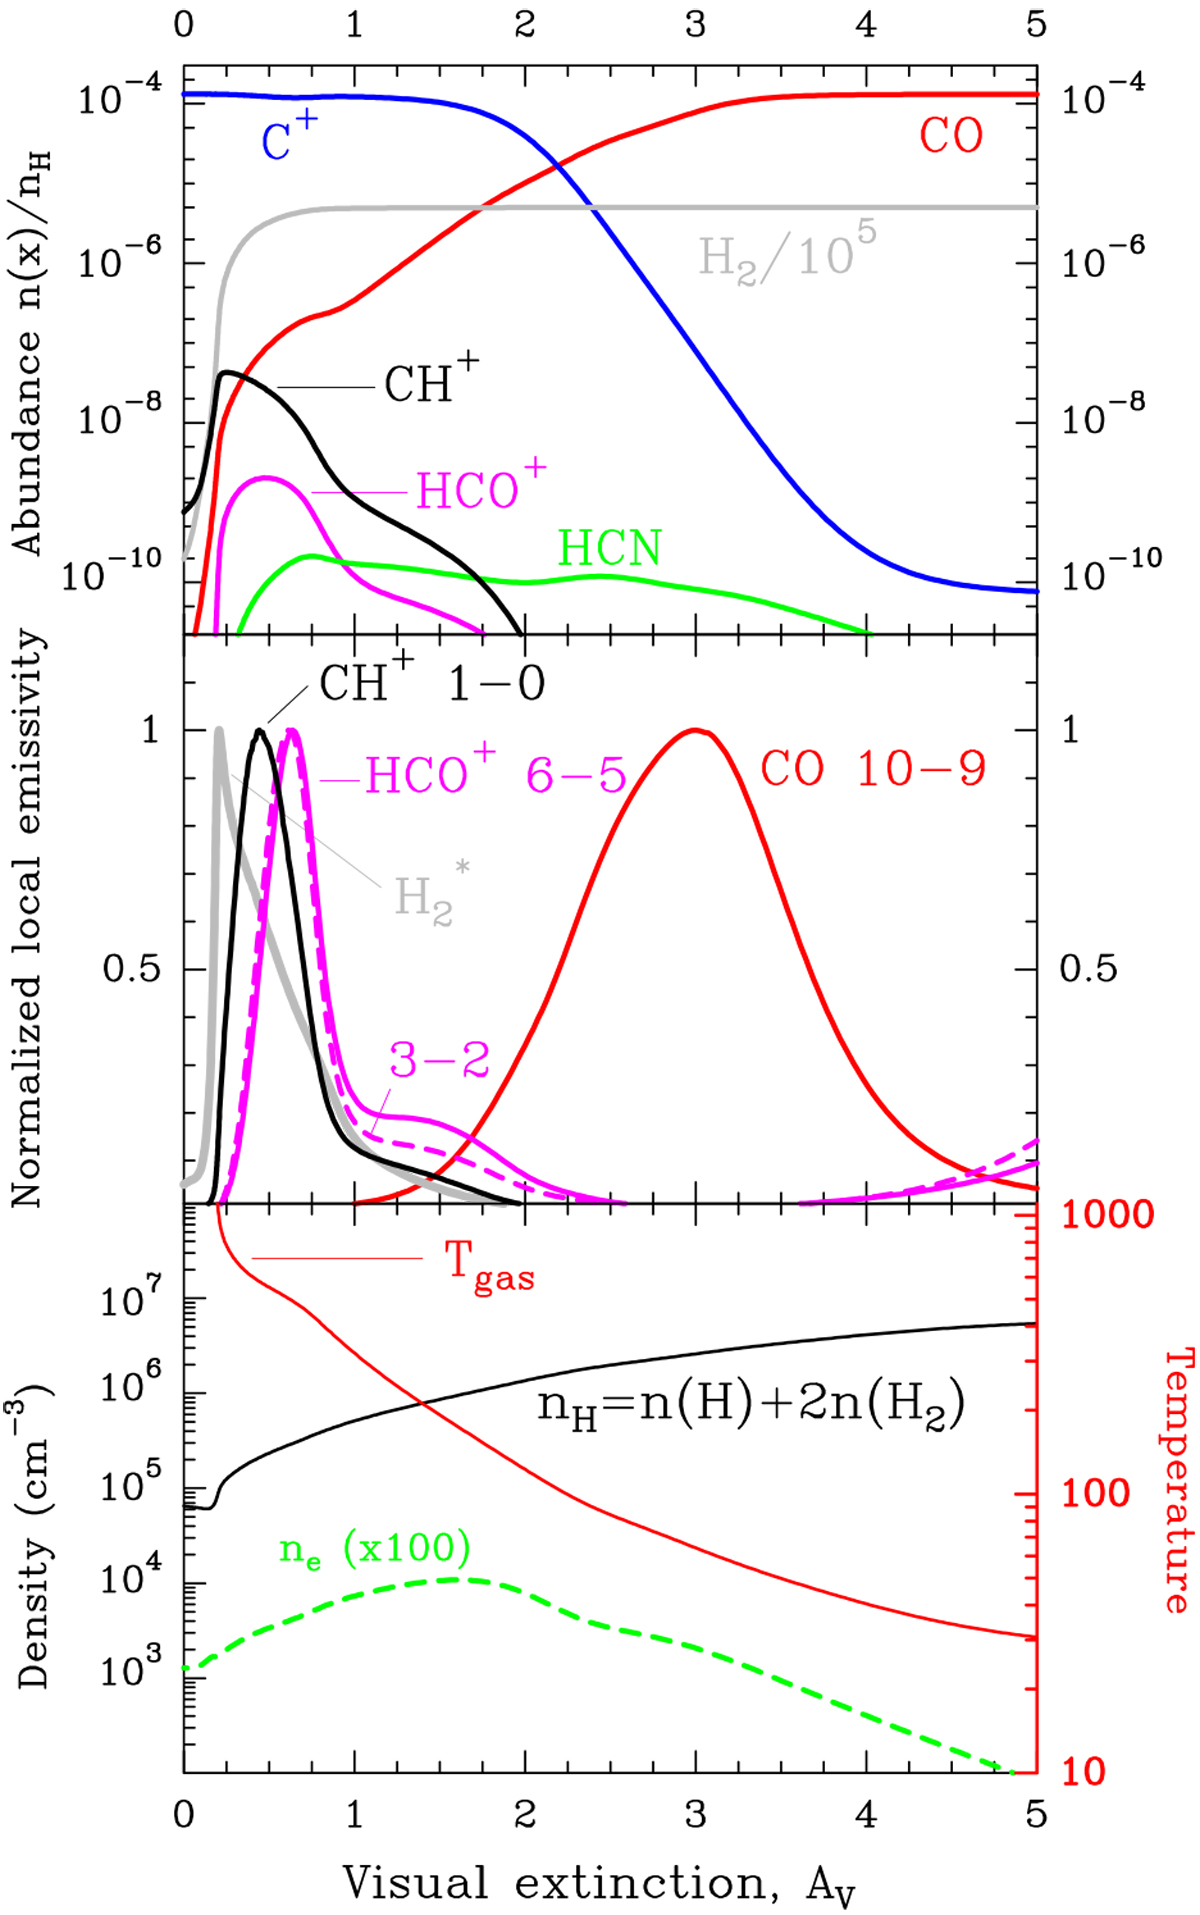
Isobaric PDR model with Pth = 108 cm−3 K and G0 = 7.5 × 10³, the mean G0 in OMC-1. Top panel: fractional abundances as a function of visual extinction (AV) into the molecular cloud. Middle panel: normalized local line emissivities. H![]() stands for the H2 v = 1–0 S(1) line at 2.12 μm. Bottom panel: predicted gas temperature (Tgas), hydrogen nuclei gas density (nH) and electron density (ne) gradients.
stands for the H2 v = 1–0 S(1) line at 2.12 μm. Bottom panel: predicted gas temperature (Tgas), hydrogen nuclei gas density (nH) and electron density (ne) gradients.
Current usage metrics show cumulative count of Article Views (full-text article views including HTML views, PDF and ePub downloads, according to the available data) and Abstracts Views on Vision4Press platform.
Data correspond to usage on the plateform after 2015. The current usage metrics is available 48-96 hours after online publication and is updated daily on week days.
Initial download of the metrics may take a while.