Fig. 1
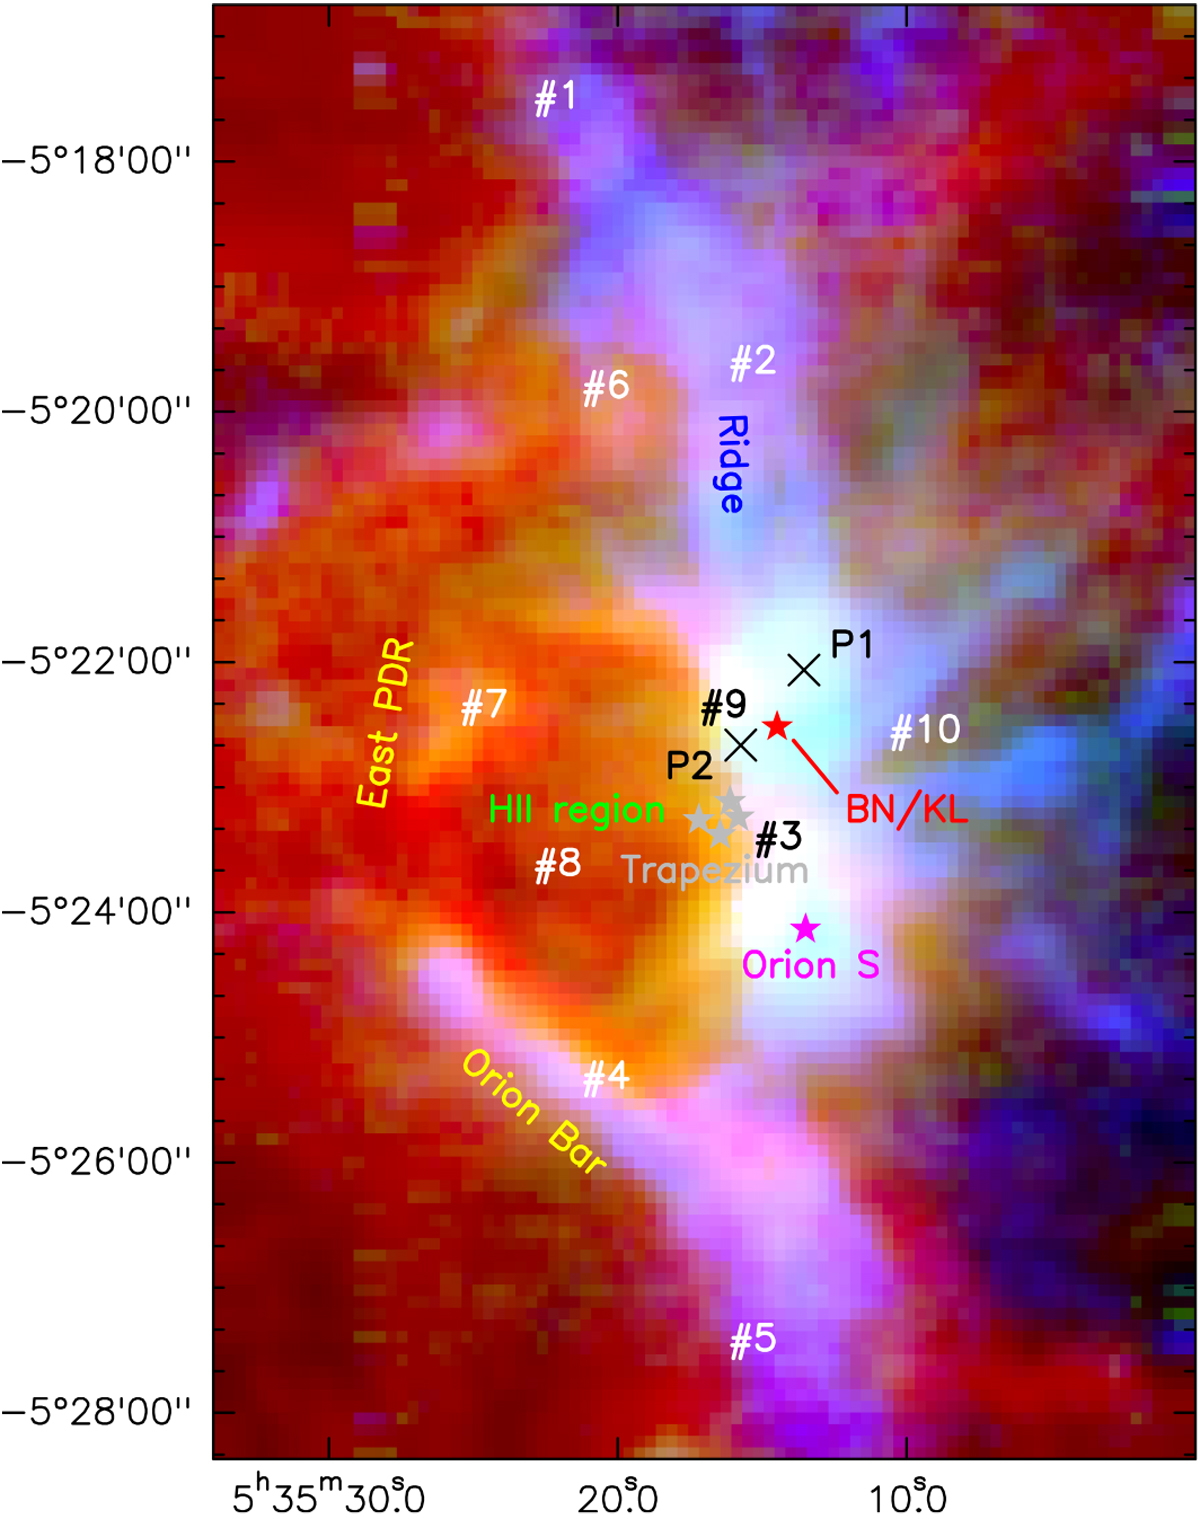
RGB multitracer view of OMC-1 at ~12′′ resolution. Red: [C II] 158 μm emission from FUV-illuminated surface of the molecular cloud (Goicoechea et al. 2015a). Green: HCO+ (J = 3–2) from warm and dense gas. Blue: C18O (J = 2–1) from colder and more FUV-shielded gas. Main regions in OMC-1 are labeled and representative positions discussed in the text are indicated with numbers.
Current usage metrics show cumulative count of Article Views (full-text article views including HTML views, PDF and ePub downloads, according to the available data) and Abstracts Views on Vision4Press platform.
Data correspond to usage on the plateform after 2015. The current usage metrics is available 48-96 hours after online publication and is updated daily on week days.
Initial download of the metrics may take a while.