Fig. 9
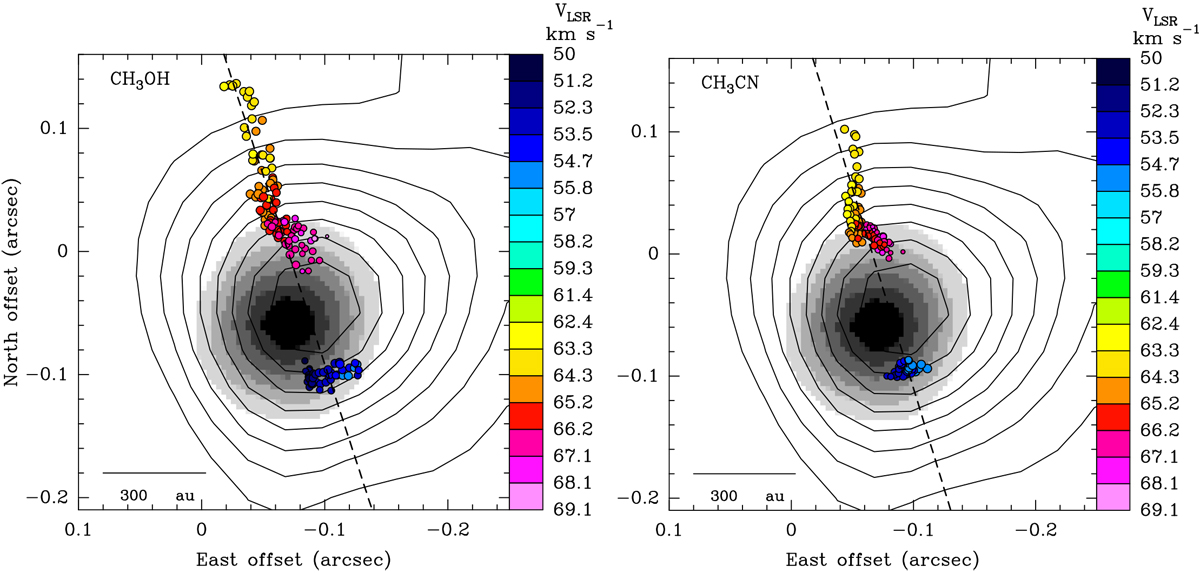
The disk around the high-mass YSO Bm. Colored dots indicate the peak positions of the most blue- and red-shifted velocity channels for the emission of the nine CH3 OH (left panel) and seven CH3CN (right panel) lines listed in Table 2. Colors represent VLSR as coded on the right of each panel. The dashed black lines, at PA = 18° and 17° for CH3 OH and CH3CN, respectively, show the linear fits to the spatial distribution of the channel peaks. The grayscale-filled and black contours represent the JVLA 22-GHz and 13-GHz continuum, respectively, with the same levels as in Fig. 4.
Current usage metrics show cumulative count of Article Views (full-text article views including HTML views, PDF and ePub downloads, according to the available data) and Abstracts Views on Vision4Press platform.
Data correspond to usage on the plateform after 2015. The current usage metrics is available 48-96 hours after online publication and is updated daily on week days.
Initial download of the metrics may take a while.