Fig. 7
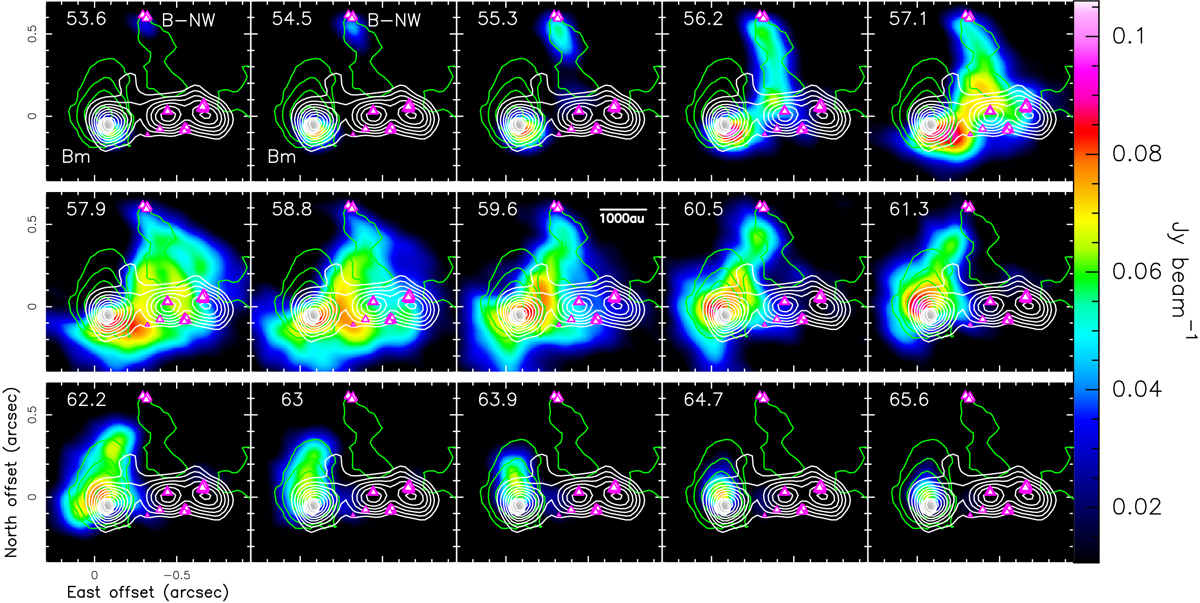
Color map of the intensity of the CH3CN JK = 142–132 line (Eu = 121 K) at a differentVLSR (km s−1), indicated in the upper-left corner of each panel. The color-intensity scale is shown on the right. The grayscale-filled and white contours show the JVLA 22-GHz and 13-GHz continuum, respectively, plotting the same levels as in Fig. 4. The green contours reproduce the ALMA 1.2-mm continuum, showing levels at 10, 20, 40, and 80% of the peak emission of 0.032 Jy beam−1. The magenta-edged white triangles mark the positions of the 22-GHz water masers derived through VLBI observations by Sanna et al. (2010). Upper first and second panels: high-mass YSO Bm, and the compact molecular source B-NW are labeled.
Current usage metrics show cumulative count of Article Views (full-text article views including HTML views, PDF and ePub downloads, according to the available data) and Abstracts Views on Vision4Press platform.
Data correspond to usage on the plateform after 2015. The current usage metrics is available 48-96 hours after online publication and is updated daily on week days.
Initial download of the metrics may take a while.