Fig. 6
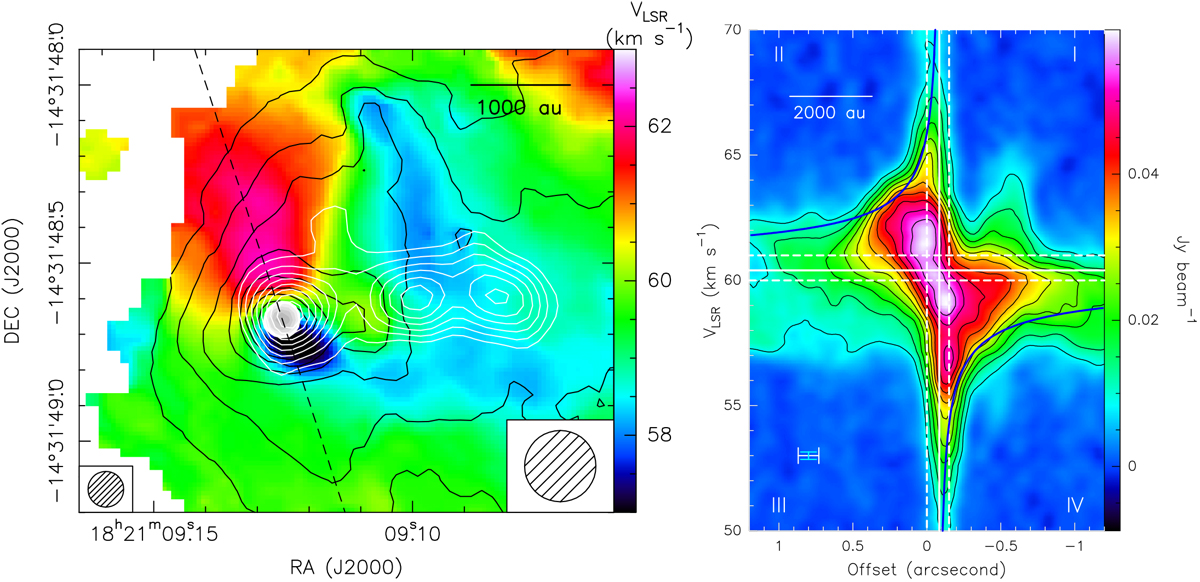
As in Fig. 4 but for the C34S J = 5–4 line (Eu = 28 K). Left panel: black contours show the velocity-integrated intensity with levels ranging from 10 to 90% of 0.8 Jy beam−1 km s−1 in steps of 10%. Right panel: horizontal and vertical white continuous lines, and the blue curves mark, respectively, the VLSR and positional offset of the YSO, and the Keplerian profile around a YSO of 10 M⊙. The two horizontal and vertical, white dashed lines indicate the maximum interval of variation for the YSO VLSR and positional offset, respectively, estimated by eye whilst looking at the symmetrical patterns of the P–V plot. We note that the plotted offset range is larger than for the P–V plots of Figs. 4 and 5.
Current usage metrics show cumulative count of Article Views (full-text article views including HTML views, PDF and ePub downloads, according to the available data) and Abstracts Views on Vision4Press platform.
Data correspond to usage on the plateform after 2015. The current usage metrics is available 48-96 hours after online publication and is updated daily on week days.
Initial download of the metrics may take a while.