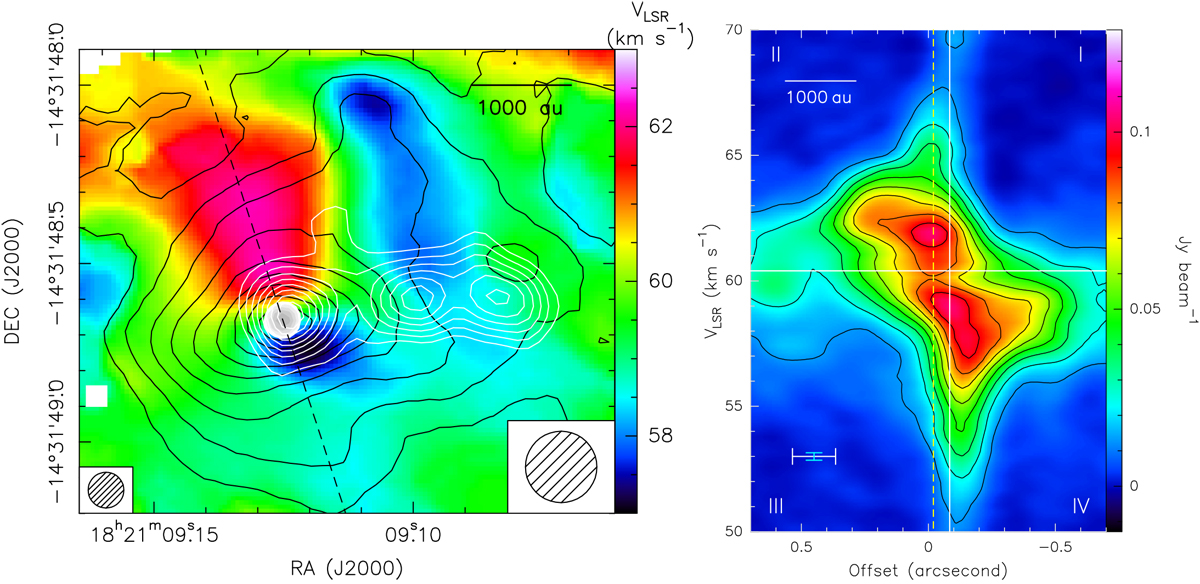
Fig. 4
Gas kinematics towards the high-mass YSO Bm. Left panel: black contours and the color map show, respectively, the velocity-integrated intensity and the intensity-averaged velocity of the CH3 OH 50,5 –40,4 line (Eu = 35 K). Plotted contours are from 10 to 90% of 1.1 Jy beam−1 km s−1 in steps of 10% and the scale on the right gives the color-velocity conversion. The grayscale-filled and white contours show the JVLA 22-GHz and 13-GHz continuum emission, respectively. Contours are from 50 to 90% of 0.28 mJy beam−1 in steps of 10% at 22 GHz, and from 20 to 90% of 0.1 mJy beam−1 in steps of 10% at 13 GHz. The JVLA beams at 22 and 13 GHz are reported in the bottom-left and bottom-right corners, respectively. Right panel: P–V plot of the CH3 OH 50,5 –40,4 line. The cut(at PA = 18°) along which positions are evaluated is indicated with the dashed black line in the left panel. To produce the P–V plot, we averaged the emission inside a strip parallel to the cut and 0.′′ 4 in width to include only the disk–envelope around the YSO. The intensity scale is shown on the right. The spatial and velocity resolutions are indicated with horizontal white and vertical cyan error bars, respectively, in the bottom-left corner. The horizontal and vertical white continuous lines mark the YSO VLSR and positional offset, respectively, estimated with a Keplerian fit (see Sect. 4). The yellow dashed vertical line indicates the positional offset of the peak of the 1.2-mm continuum emission of source B. The four quadrants are labeled.
Current usage metrics show cumulative count of Article Views (full-text article views including HTML views, PDF and ePub downloads, according to the available data) and Abstracts Views on Vision4Press platform.
Data correspond to usage on the plateform after 2015. The current usage metrics is available 48-96 hours after online publication and is updated daily on week days.
Initial download of the metrics may take a while.