Fig. 3
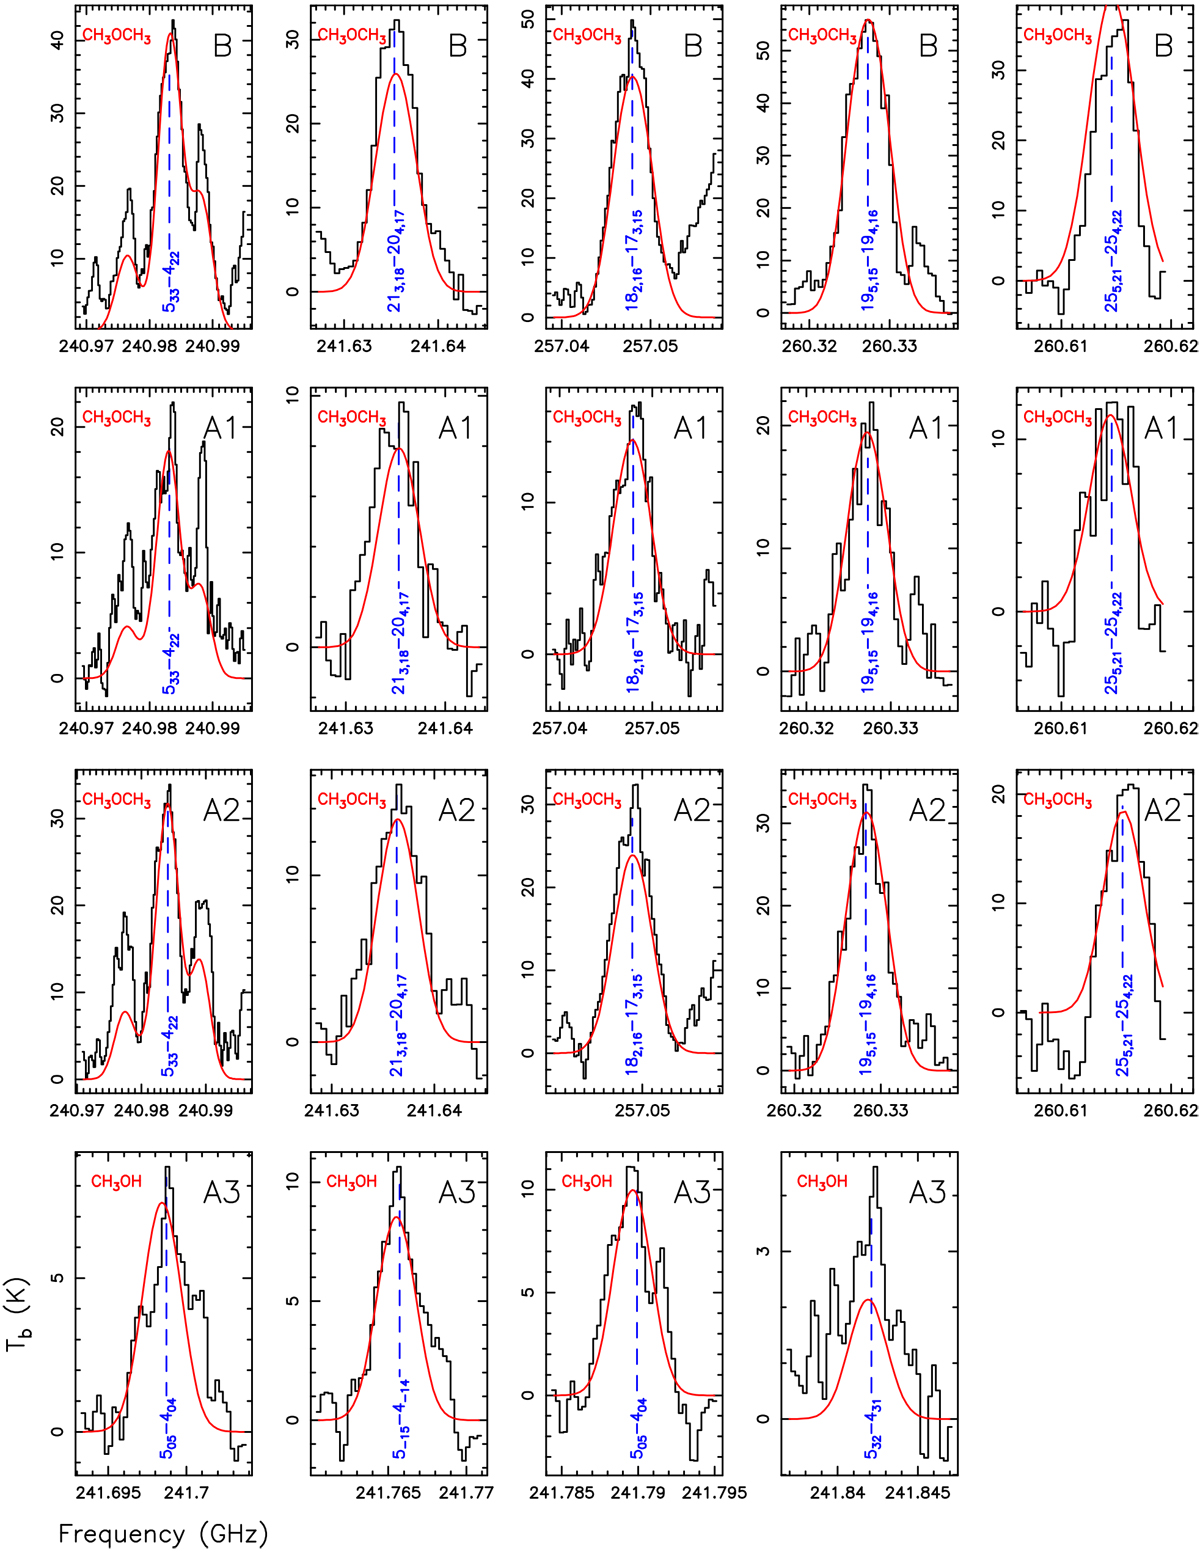
Observed spectrum and MADCUBA LTE best fit shown in black and red, respectively, in each panel. The spectra are shown as brightness temperature vs. rest frequency. In the upper-left corner and at the bottom of each panel, the molecular species and the corresponding line employed in the fit are indicated (see Table 2). Each raw refers to one of the four mm sources: B, A1, A2 and A3, from top to bottom panels, respectively.
Current usage metrics show cumulative count of Article Views (full-text article views including HTML views, PDF and ePub downloads, according to the available data) and Abstracts Views on Vision4Press platform.
Data correspond to usage on the plateform after 2015. The current usage metrics is available 48-96 hours after online publication and is updated daily on week days.
Initial download of the metrics may take a while.