Fig. 2
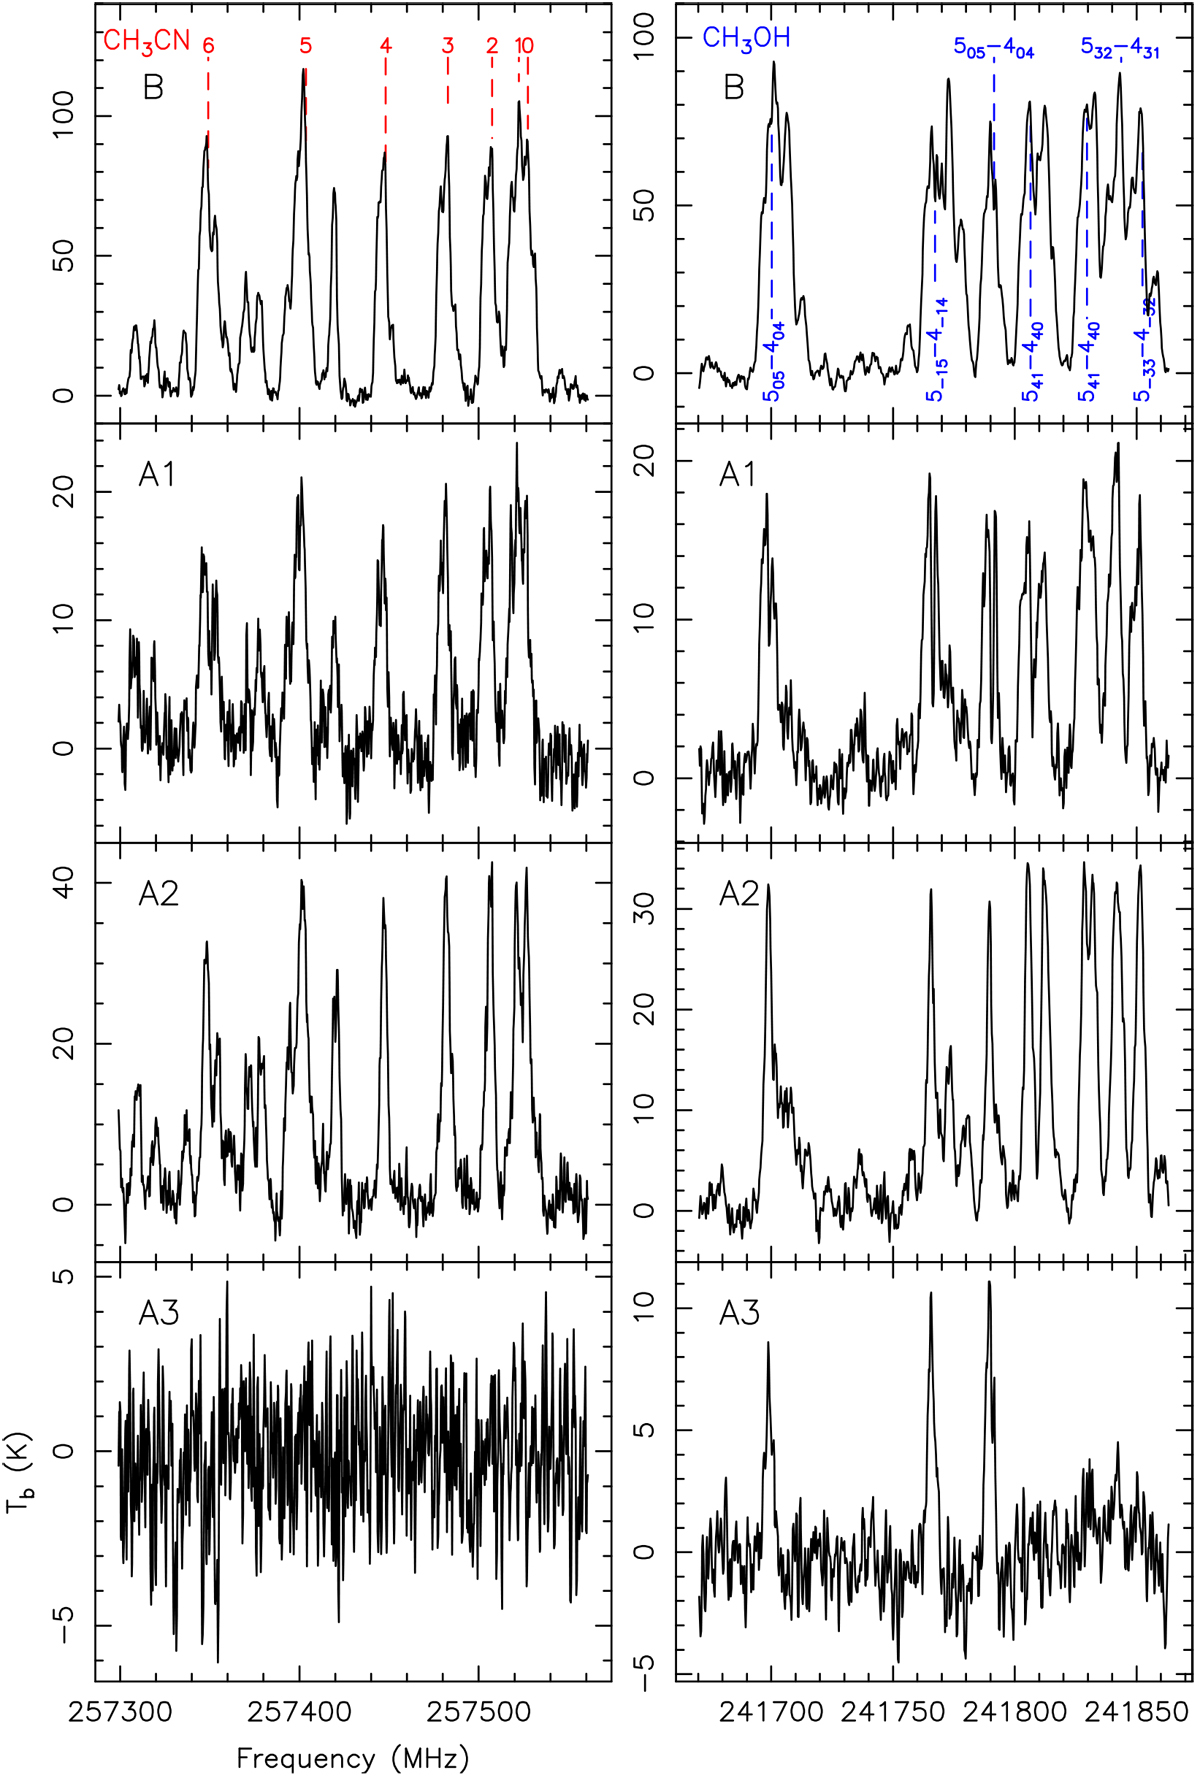
Spectra of the prominent lines of CH3CN (J = 14–13; left panels) and CH3OH (right panels) extracted at the position of the 1.2-mm peak for each of the four continuum sources B, A1, A2 and A3 (from top to bottom panels, respectively). The spectra are shown as brightness temperature vs. rest frequency. The transitions of the two molecular species (see Table 2) are labeled in the upper panels.
Current usage metrics show cumulative count of Article Views (full-text article views including HTML views, PDF and ePub downloads, according to the available data) and Abstracts Views on Vision4Press platform.
Data correspond to usage on the plateform after 2015. The current usage metrics is available 48-96 hours after online publication and is updated daily on week days.
Initial download of the metrics may take a while.