Fig. 12
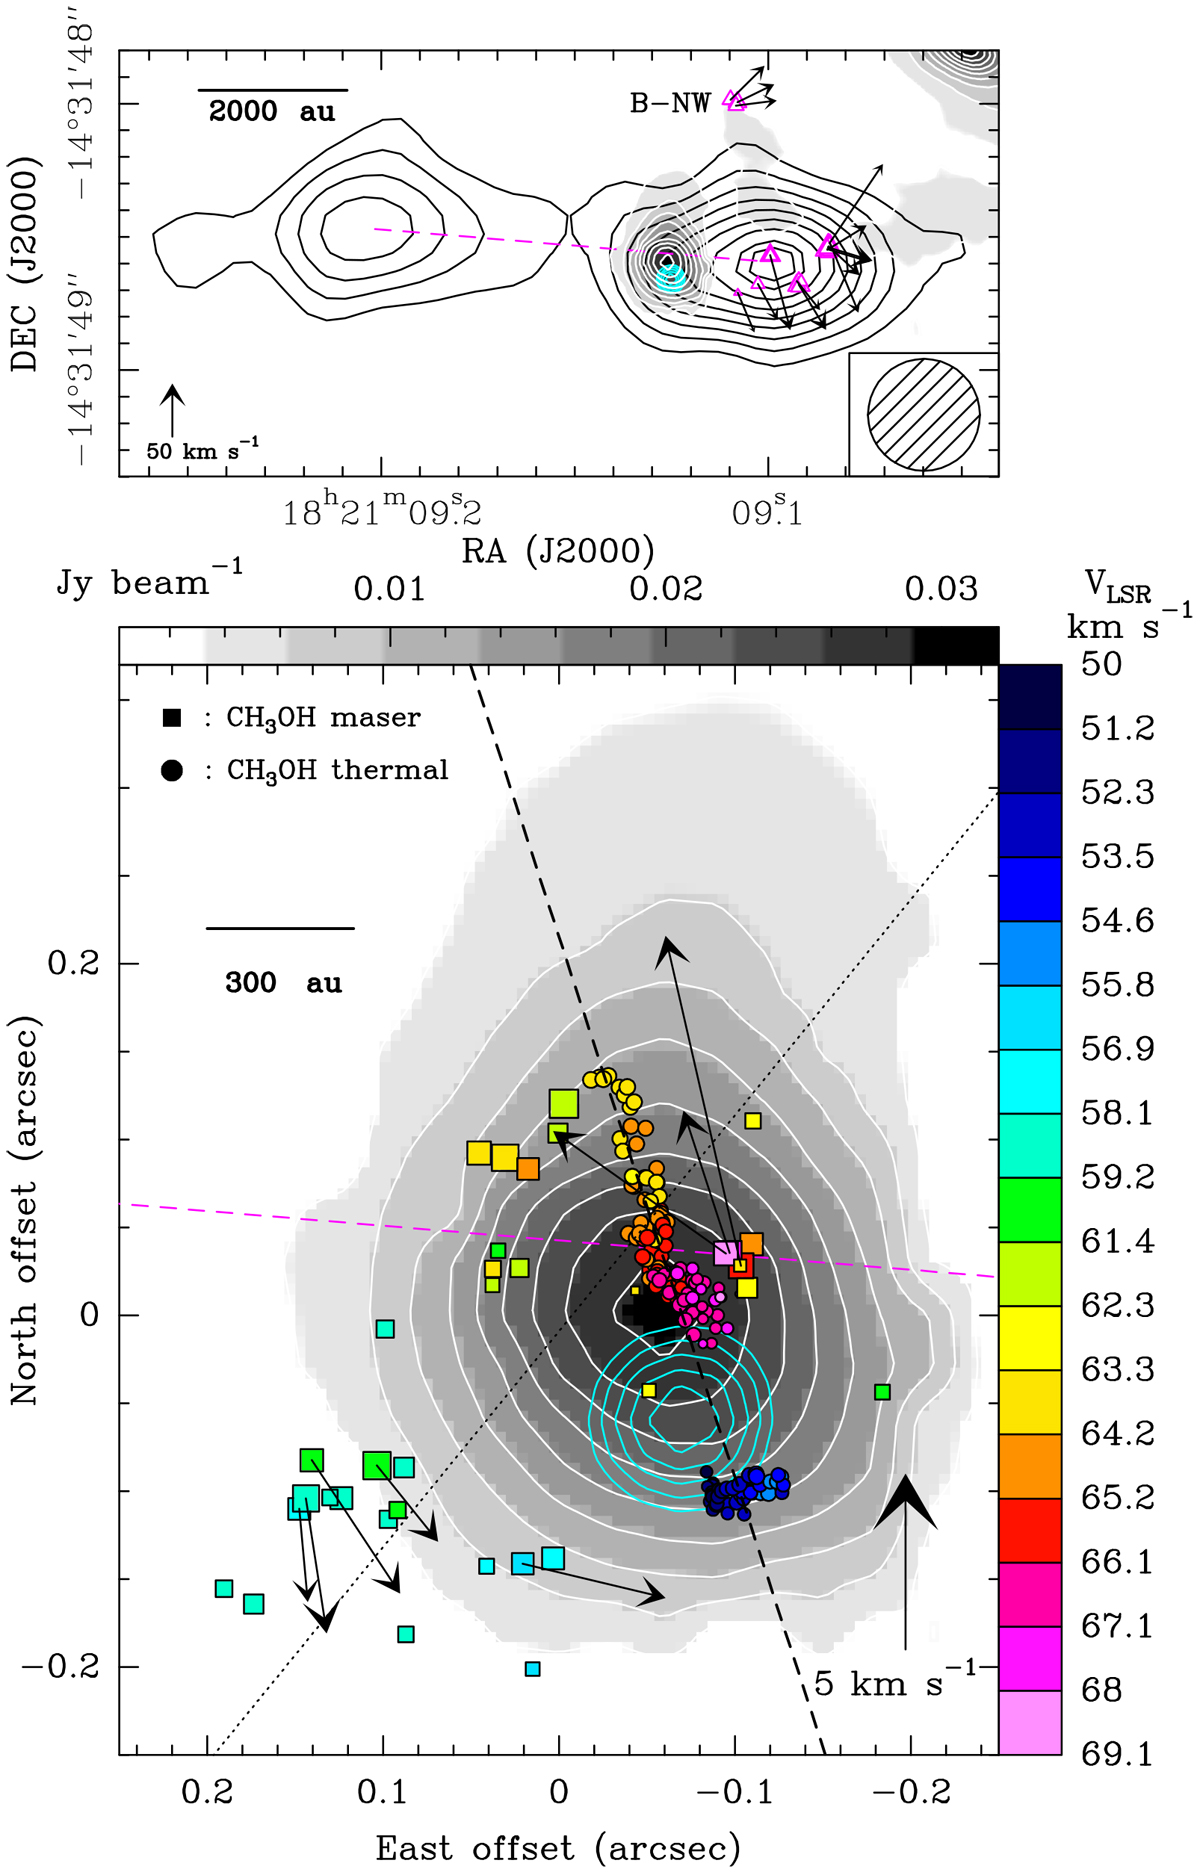
Lower panel, colored dots: positions and VLSR of the thermal CH3OH emission as in Fig. 9, with the black dashed line marking the major axis of the disk around the high-mass YSO Bm. The grayscale map and the white contours reproduce the ALMA 1.2-mm continuum. The intensity scale for the map is shown on the top, and the plotted contours are the same as in Fig. 1. The JVLA 22-GHz continuum is shown with cyan contours (same levels as in Fig. 4). Colored squares denote positions and VLSR of the 6.7-GHz CH3OH masers (Sanna et al. 2010). The maser proper motions are represented by black arrows, with the amplitude scale given in the bottom-right corner. The black dotted line marks the major axis of the distribution of the CH3 OH masers. The dashed magenta line has the same meaning as in the upper panel. Upper panel, black contours: JVLA 6-GHz continuum with levels from 20 to 90%, in steps of 10%, and 95% of 0.17 mJy beam−1. The dashed magenta line connects the peak emission of the eastern and western lobes of the radio jet. The grayscale map, and the white and cyan contours have the same meaning as in the lower panel. VLBI positions and proper motions of the water masers by Sanna et al. (2010) are indicated with magenta triangles and black arrows, respectively. The amplitude scale for the proper motions is given in the bottom-left corner. The beam of the JVLA 6 GHz continuum image is reported in the bottom-right corner.
Current usage metrics show cumulative count of Article Views (full-text article views including HTML views, PDF and ePub downloads, according to the available data) and Abstracts Views on Vision4Press platform.
Data correspond to usage on the plateform after 2015. The current usage metrics is available 48-96 hours after online publication and is updated daily on week days.
Initial download of the metrics may take a while.