Fig. 11
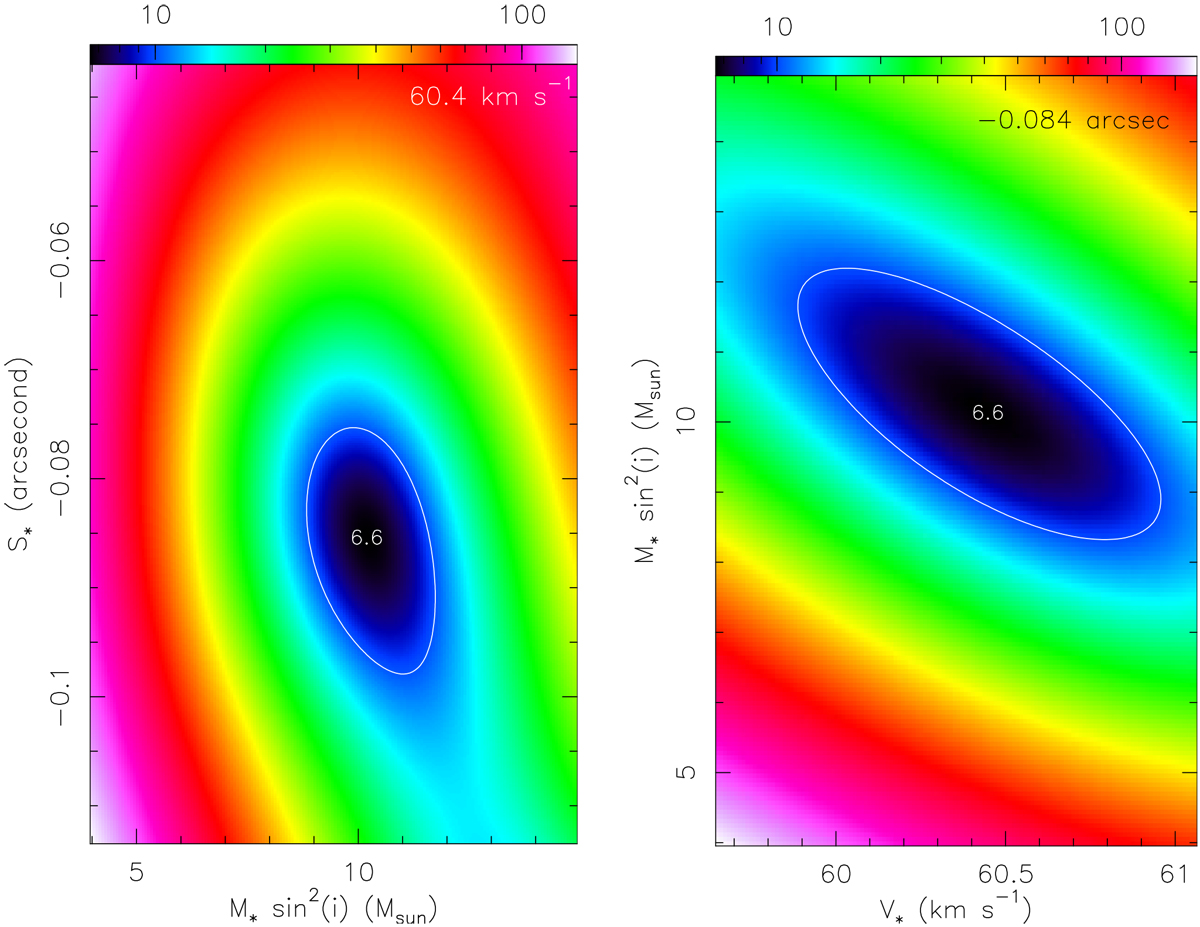
χ2 distribution from the Keplerian fit (see Fig. 10) as a function of the free parameters YSO mass and position (left panel), and YSO VLSR and mass (right panel). To produce these plots, the third free parameter of the Keplerian fit, that is, the YSO VLSR and position in the left and right plot, respectively, is taken equal to the best-fit value. The color scale at the top of each panel gives the value of the χ2 in a logarithmic scale. In each of the two plots, the position of the minimum χ2, ![]() = 6.6, is labeled, and the white contour indicates the level
= 6.6, is labeled, and the white contour indicates the level ![]() +3.5 = 10.1, which corresponds to the 1-σ confidence level for three free parameters (Lampton et al. 1976).
+3.5 = 10.1, which corresponds to the 1-σ confidence level for three free parameters (Lampton et al. 1976).
Current usage metrics show cumulative count of Article Views (full-text article views including HTML views, PDF and ePub downloads, according to the available data) and Abstracts Views on Vision4Press platform.
Data correspond to usage on the plateform after 2015. The current usage metrics is available 48-96 hours after online publication and is updated daily on week days.
Initial download of the metrics may take a while.