Fig. 10
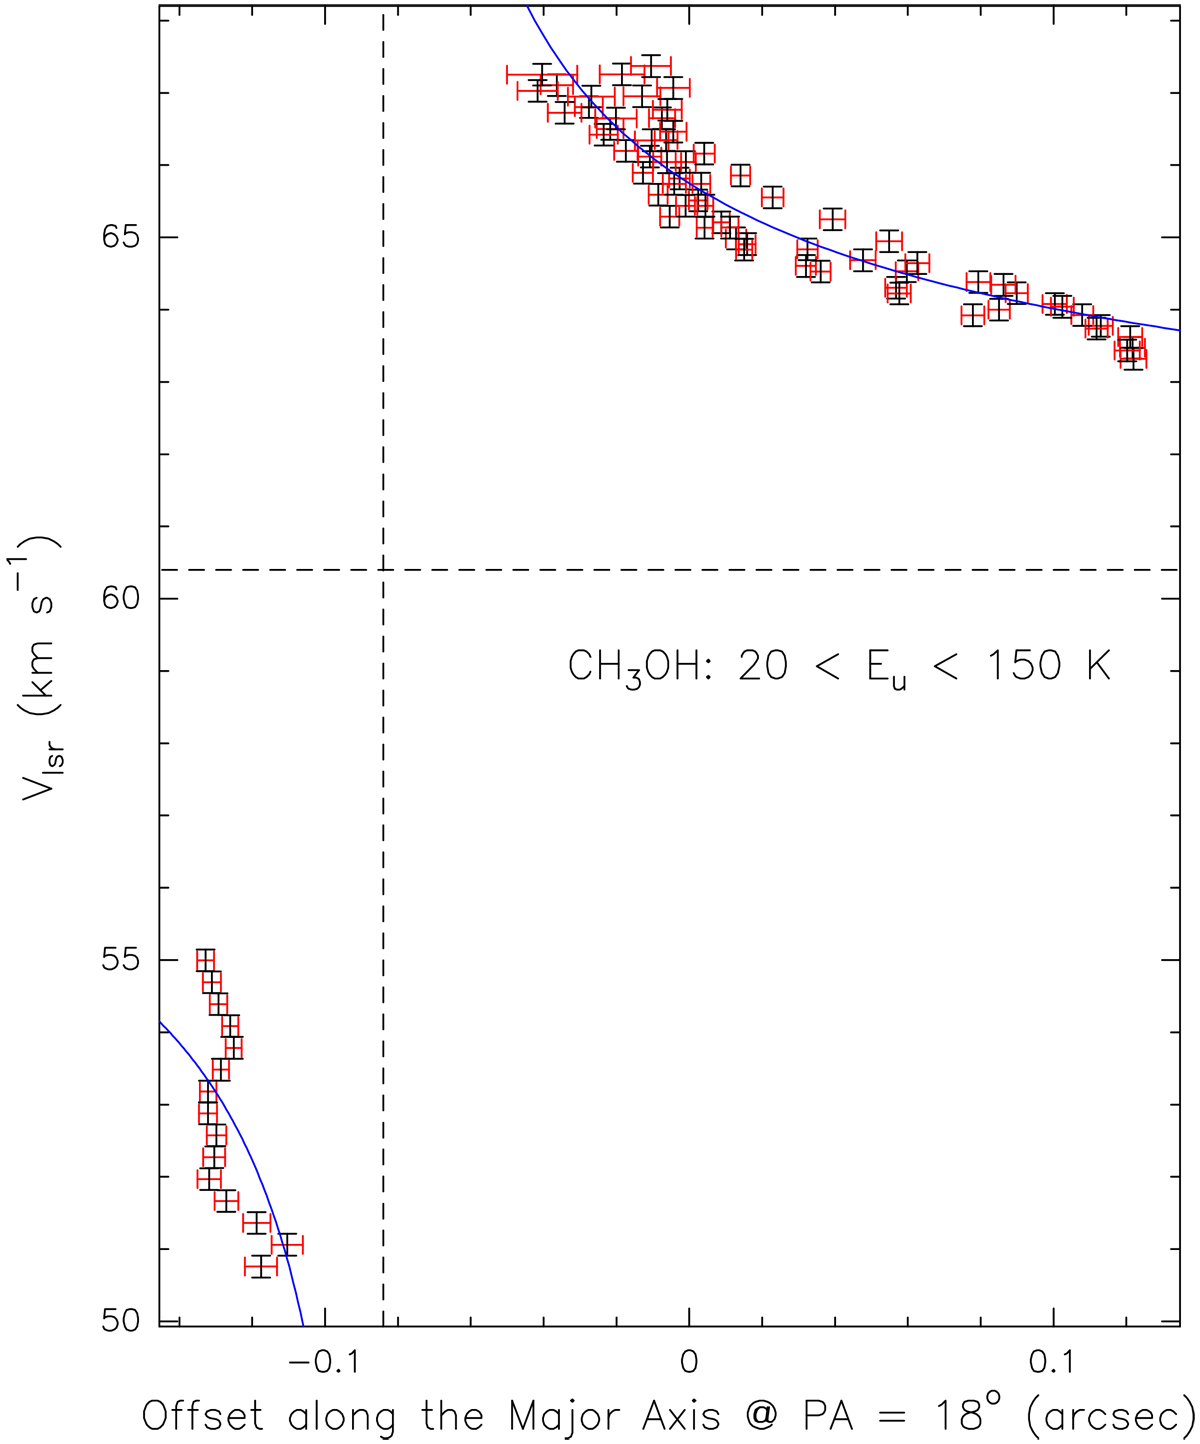
Red and black error bars: major-axis projected positions and VLSR (together with the corresponding errors), respectively, for the highest-velocity emission peaks of the six CH3 OH lines with 20 K ≤ Eu ≤ 150 K listed in Table 2. The blue curve is the best Keplerian fit to the data. The horizontal and vertical dashed lines indicate the fitted YSO VLSR and position, respectively.
Current usage metrics show cumulative count of Article Views (full-text article views including HTML views, PDF and ePub downloads, according to the available data) and Abstracts Views on Vision4Press platform.
Data correspond to usage on the plateform after 2015. The current usage metrics is available 48-96 hours after online publication and is updated daily on week days.
Initial download of the metrics may take a while.