Fig. 1
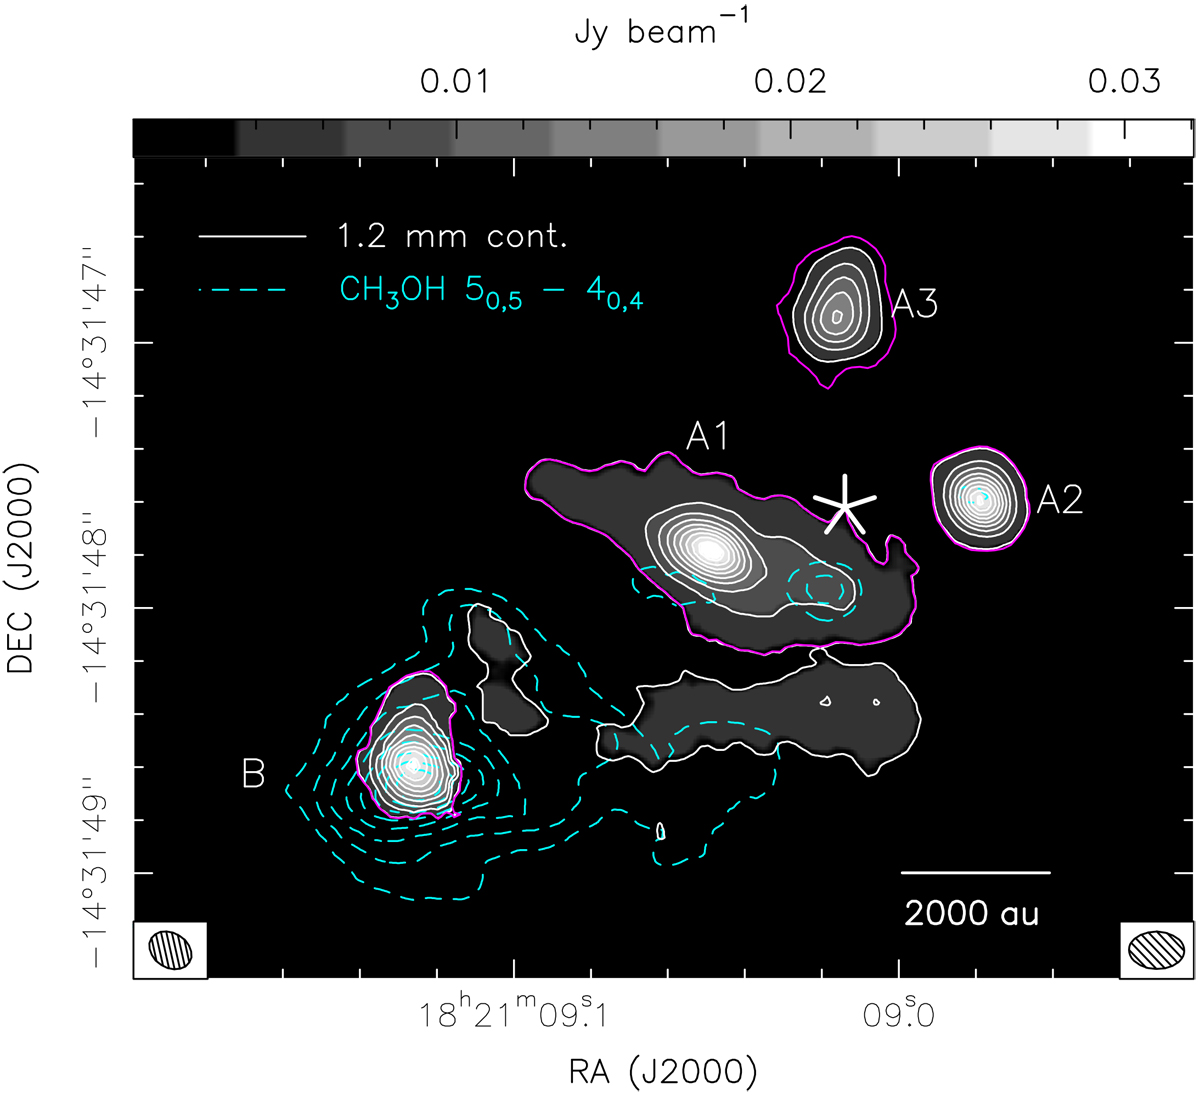
ALMA 1.2-mm continuum (grayscale map and white contours). The color scale at the topgives the intensity of the map. The plotted levels are from 10 to 90% of 0.032 Jy beam−1 in steps of 10%. The main continuum sources are indicated with their corresponding labels. The level at 10% of the peak around each source is plotted in magenta. The velocity-integrated intensity of the CH3 OH 50,5 –40,4 line is shown with dashed cyan contours, plotting levels from 20 to 90% of 1.1 Jy beam−1 km s−1 in steps of 10%. The ALMA beams for the continuum and the CH3OH 50,5 –40,4 line are reported on the bottom left and right corners, respectively. The big white star marks the position of source “a” (Moscadelli et al. 2013).
Current usage metrics show cumulative count of Article Views (full-text article views including HTML views, PDF and ePub downloads, according to the available data) and Abstracts Views on Vision4Press platform.
Data correspond to usage on the plateform after 2015. The current usage metrics is available 48-96 hours after online publication and is updated daily on week days.
Initial download of the metrics may take a while.