Fig. 4.
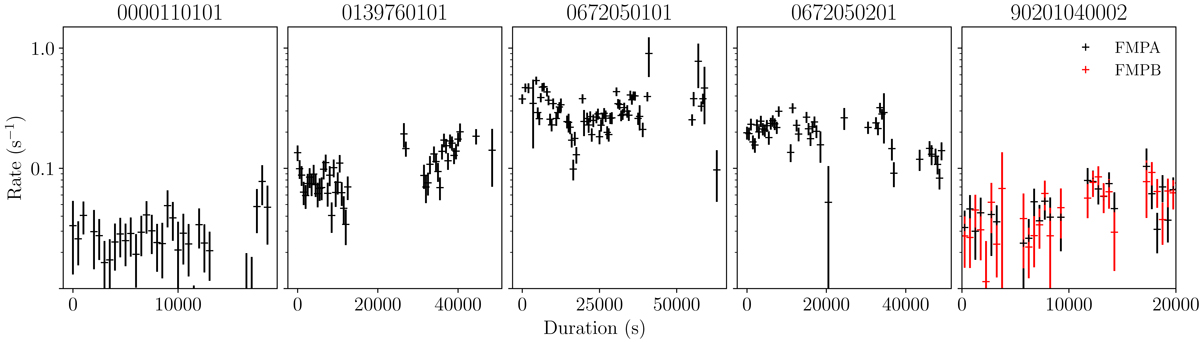
Background subtracted, 500 s bin light curves of CI Cam for each of the four XMM-Newton EPIC-pn observations and the NuSTAR observation. The XMM-Newton light curves cover the 0.2–12.0 keV energy range, while the NuSTAR light curve covers the 3.0–79.0 keV range. All observations are shown on the same logarithmic scale to facilitate easy comparison.
Current usage metrics show cumulative count of Article Views (full-text article views including HTML views, PDF and ePub downloads, according to the available data) and Abstracts Views on Vision4Press platform.
Data correspond to usage on the plateform after 2015. The current usage metrics is available 48-96 hours after online publication and is updated daily on week days.
Initial download of the metrics may take a while.