Fig. 3.
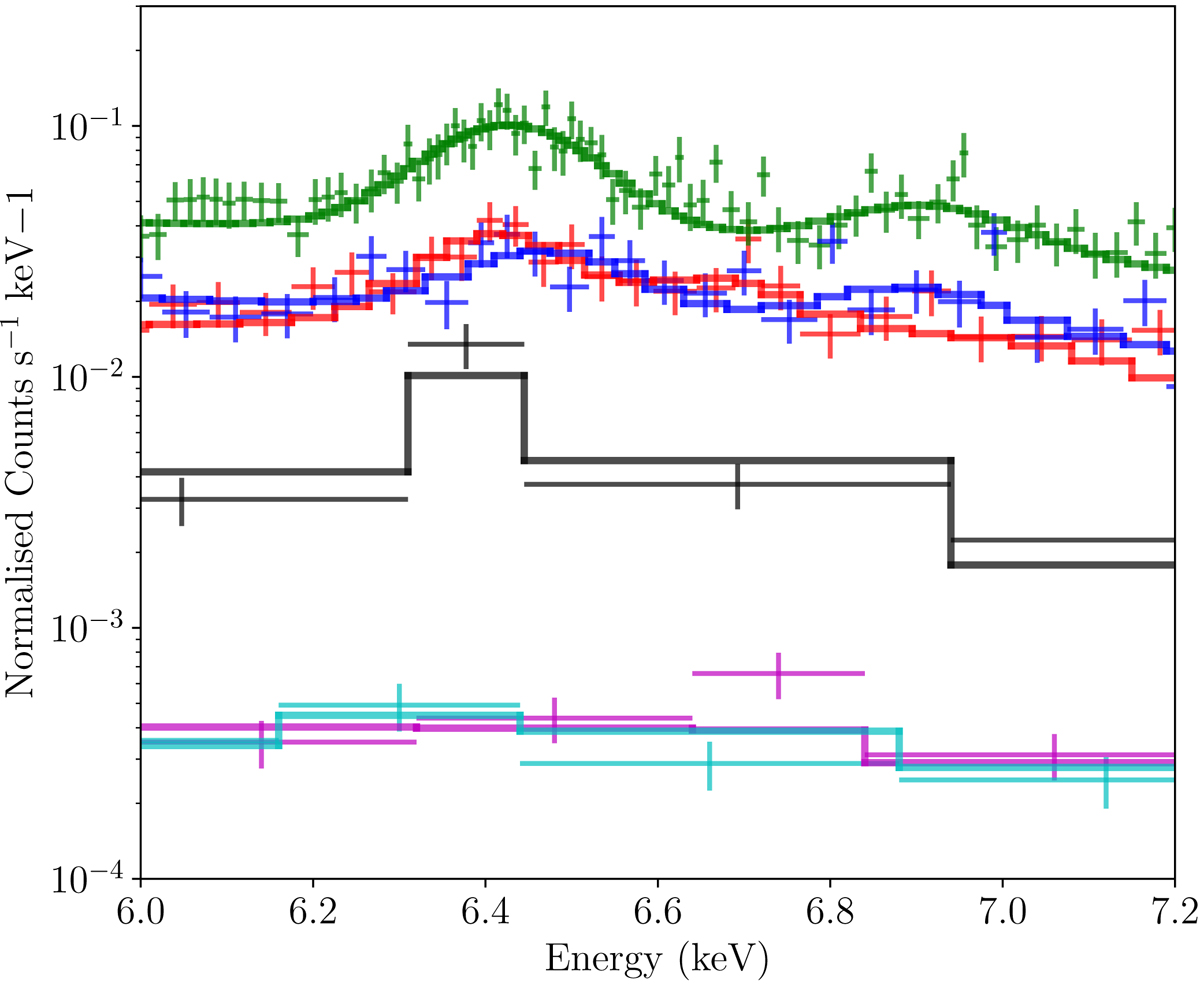
Close up of the 6.0–7.2 keV energy range that includes the region initially excluded from the spectral fits, along with the best fit TBabs(bbody+TBabs(po)+Gaus+Gaus) model (though we note that both models give identical parameters for the iron lines within errors). The NuSTAR data has been divided by 10 in this plot for clarity. The colour coding is the same as for Fig. 2.
Current usage metrics show cumulative count of Article Views (full-text article views including HTML views, PDF and ePub downloads, according to the available data) and Abstracts Views on Vision4Press platform.
Data correspond to usage on the plateform after 2015. The current usage metrics is available 48-96 hours after online publication and is updated daily on week days.
Initial download of the metrics may take a while.