Fig. B.1
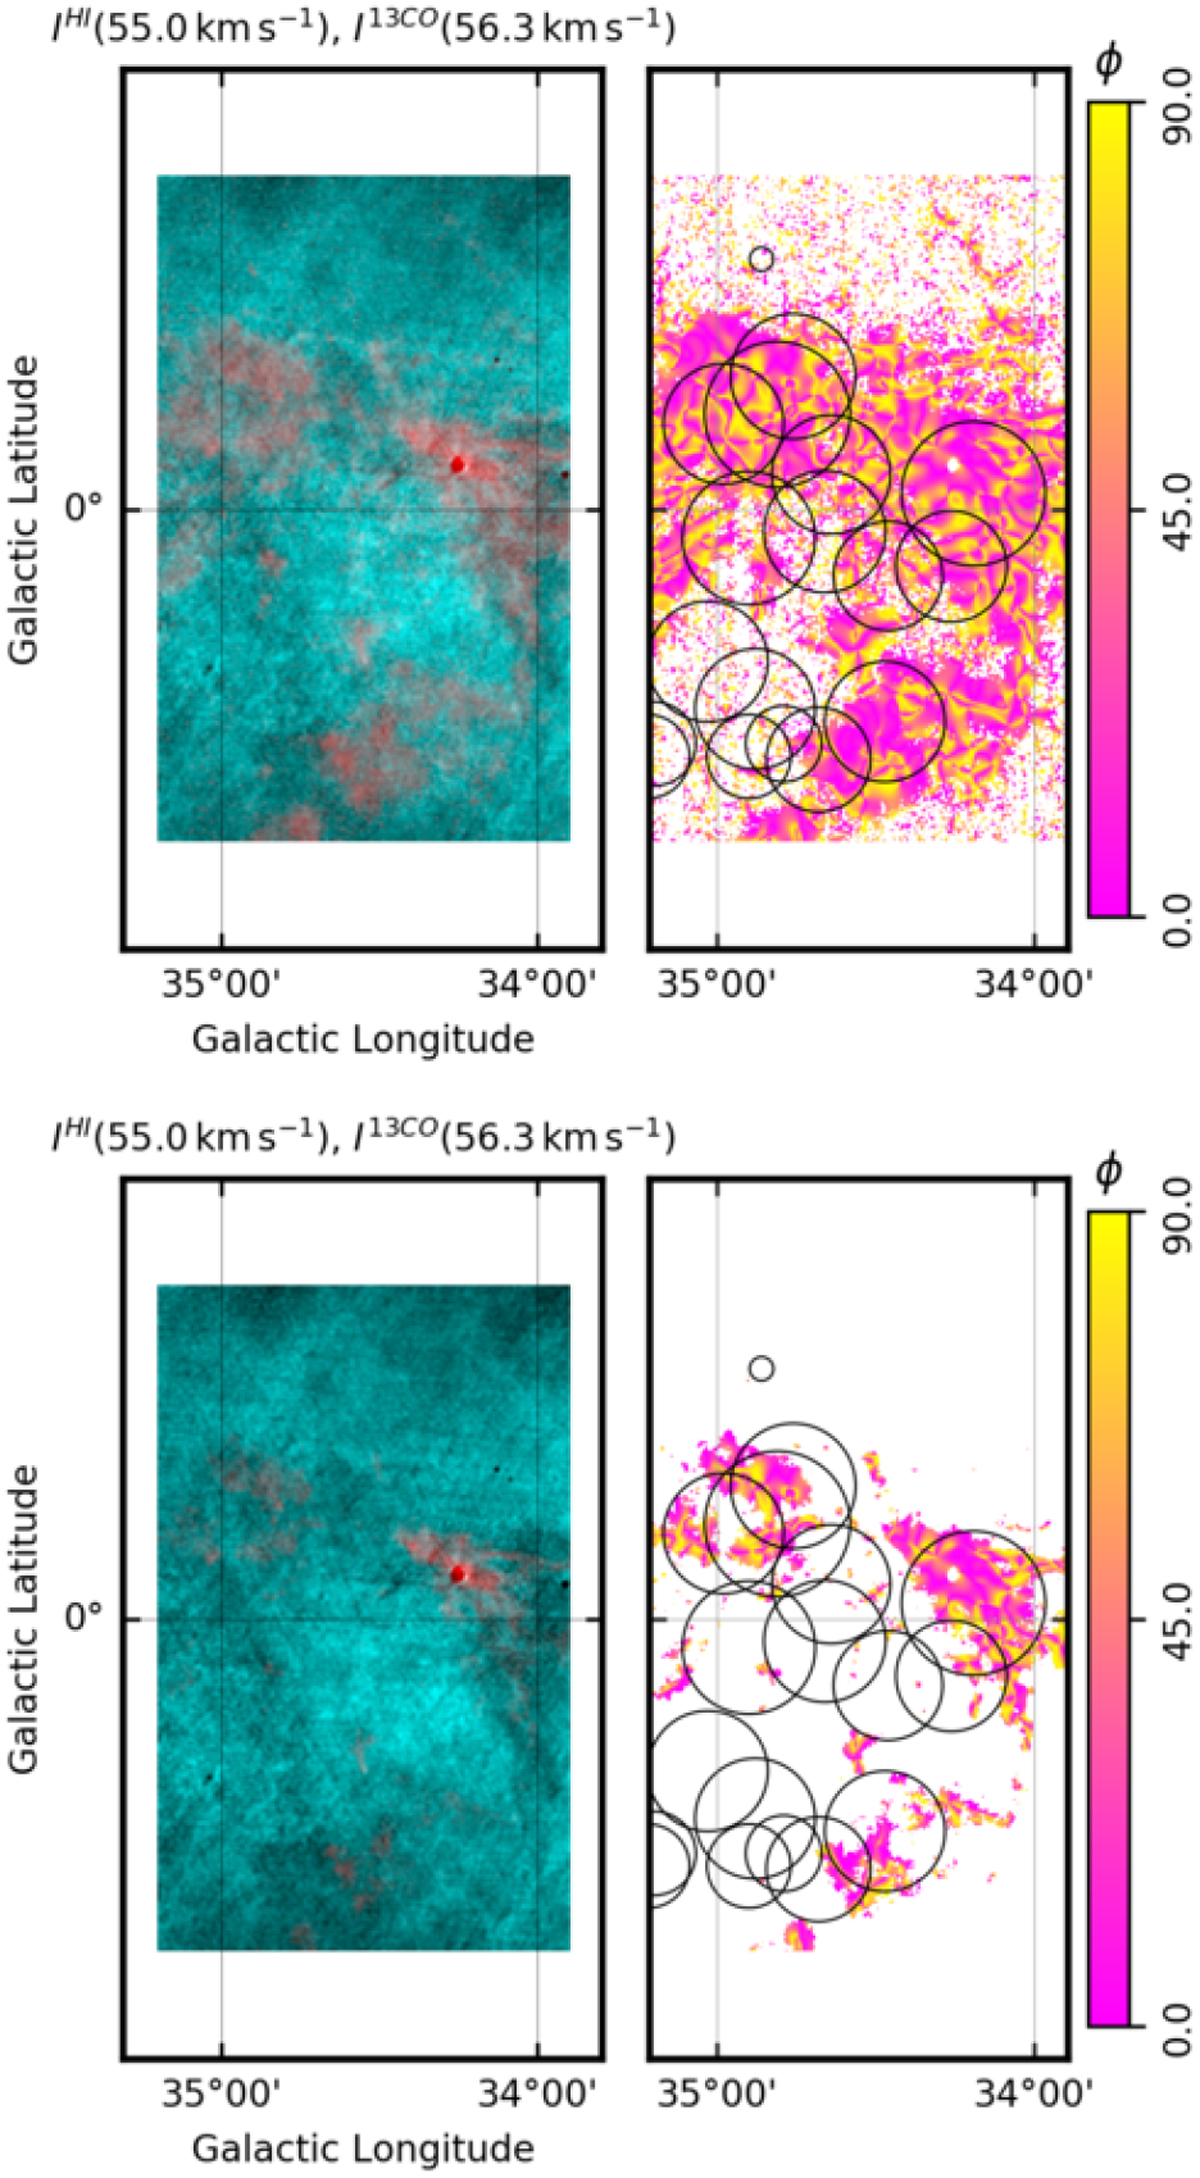
Intensity and relative orientation angle maps from the THOR HI and GRS 13CO observations presented in Fig. 7. Left panels: HI (teal) and 13CO emission (red) in the velocity channels with the largest spatial correlation in the velocity range 30 ≤ vLSR ≤ 60 km s−1, as inferred from the V values shown in Fig. 9. Right panels: relative orientation angle ϕ, Eq. (1), between the gradients of the HI and 13CO intensity maps in the indicated velocity channels. The white portions of the ϕ map correspond to areas where the gradient is not significant in either tracer, as estimated using the rejection criteria I ≥ σI (top panels) and I ≥ 7σI (bottom panels). The black circles in the right panels correspond to the positions and effective sizes of the MC candidates from the Rathborne et al. (2009) catalog in the aforementioned velocity range.
Current usage metrics show cumulative count of Article Views (full-text article views including HTML views, PDF and ePub downloads, according to the available data) and Abstracts Views on Vision4Press platform.
Data correspond to usage on the plateform after 2015. The current usage metrics is available 48-96 hours after online publication and is updated daily on week days.
Initial download of the metrics may take a while.