Fig. 9
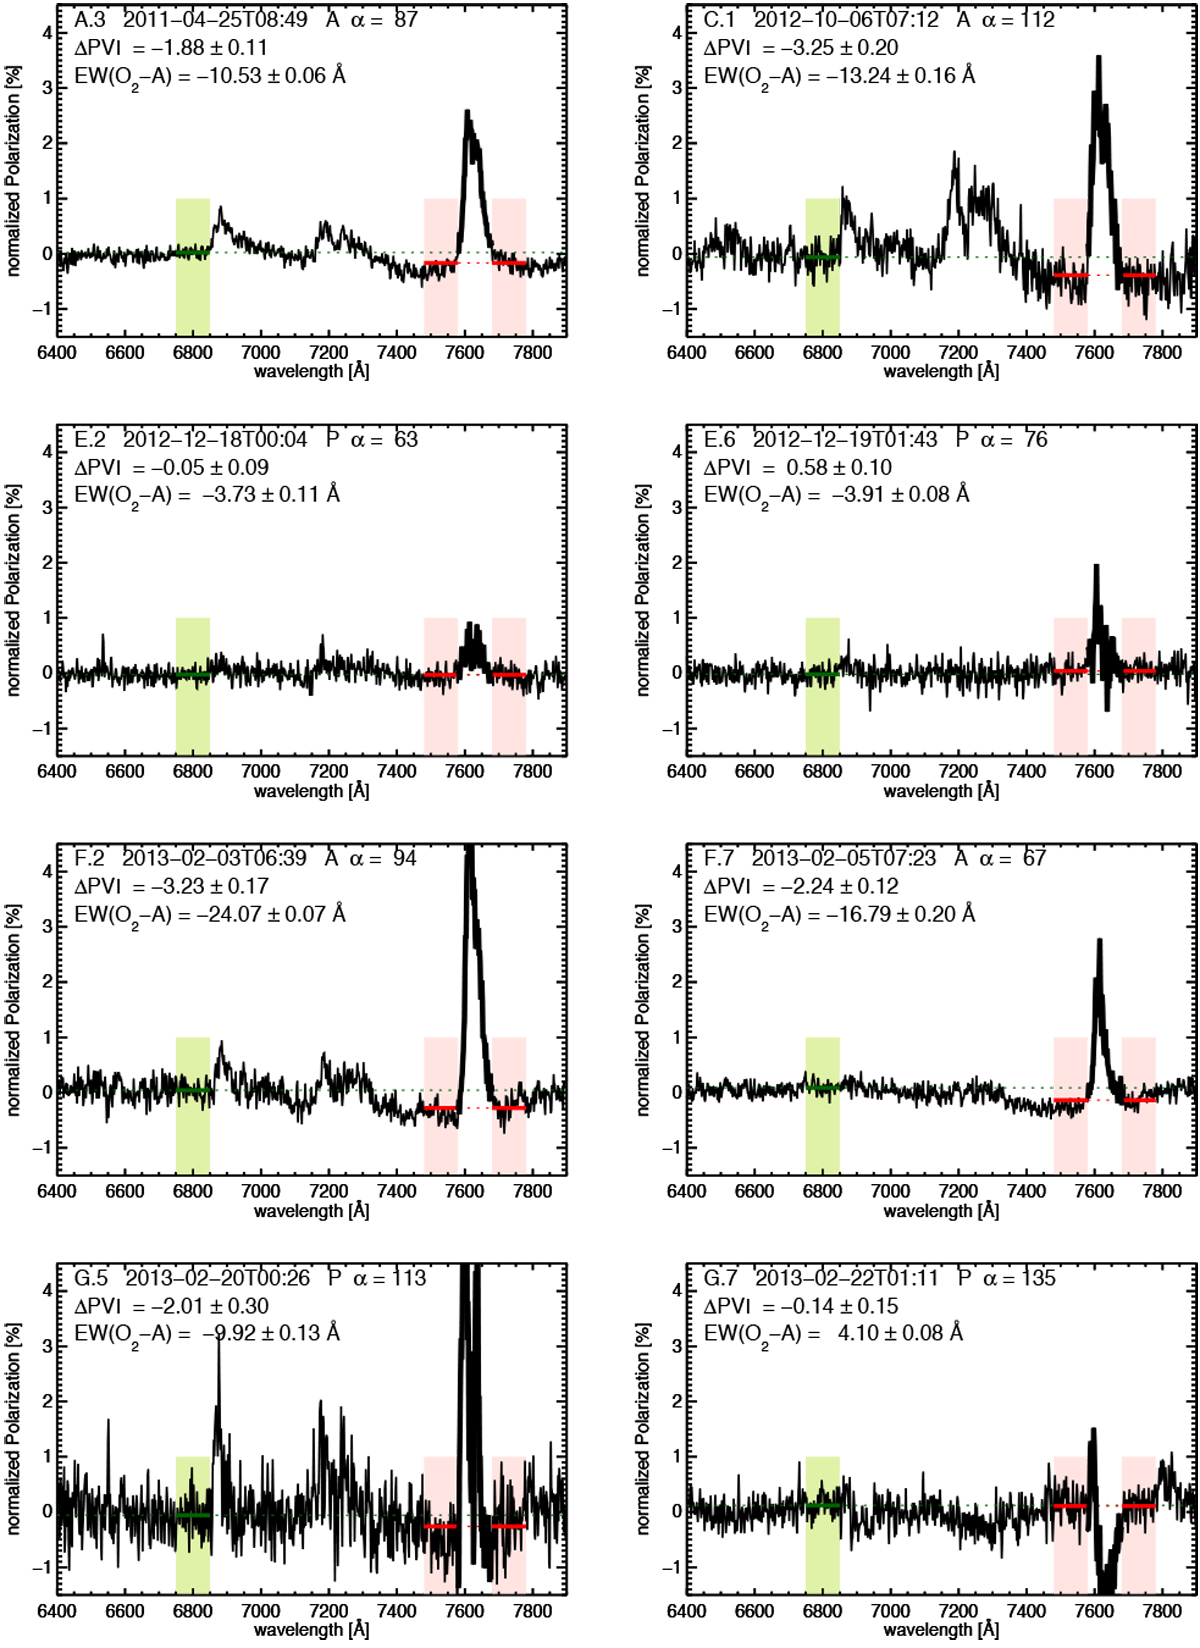
Selection of normalized spectra between 6400 and 8000 Å. The horizontally dotted lines indicate the regions across which the vegetation index ΔPVI, associated with the VRE: blueward (between 6750 and 6850 Å; green dotted line) and redward (between 7480 and 7780 Å, but avoiding the region affected by the O2 -A between 7580 and 7680 Å; red dotted line). The difference between the green and red dotted lines defines the amount of ΔPVI. The derivation of EW(O2-A) is explained in the text.
Current usage metrics show cumulative count of Article Views (full-text article views including HTML views, PDF and ePub downloads, according to the available data) and Abstracts Views on Vision4Press platform.
Data correspond to usage on the plateform after 2015. The current usage metrics is available 48-96 hours after online publication and is updated daily on week days.
Initial download of the metrics may take a while.