Free Access
Fig. 13
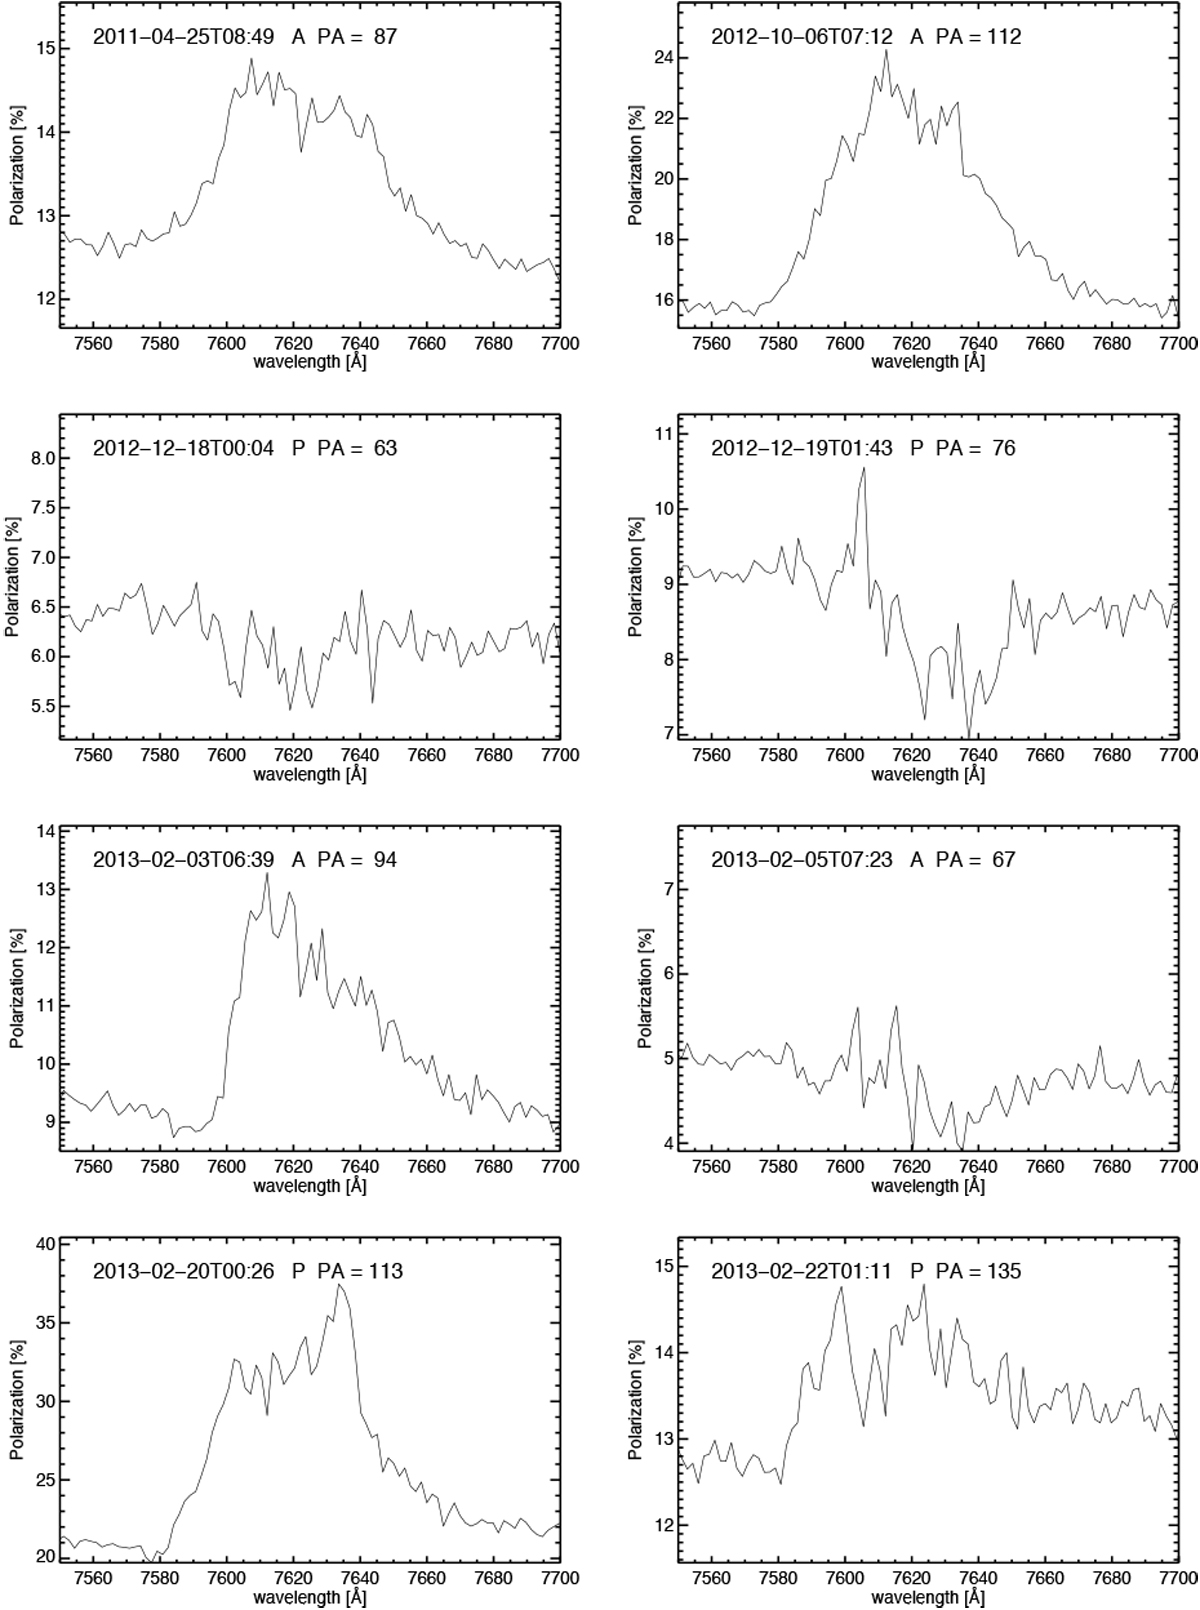
O2-A band regionbetween 7550 and 7700 Å for eight high-spectral resolution polarization spectra observed with grism 600I. Spectra are corrected for lunar depolarization, i.e., they should correspond to true polarization values of Earth at these epochs. The fine structure seen in the absorption band is real.
Current usage metrics show cumulative count of Article Views (full-text article views including HTML views, PDF and ePub downloads, according to the available data) and Abstracts Views on Vision4Press platform.
Data correspond to usage on the plateform after 2015. The current usage metrics is available 48-96 hours after online publication and is updated daily on week days.
Initial download of the metrics may take a while.