Fig. 12
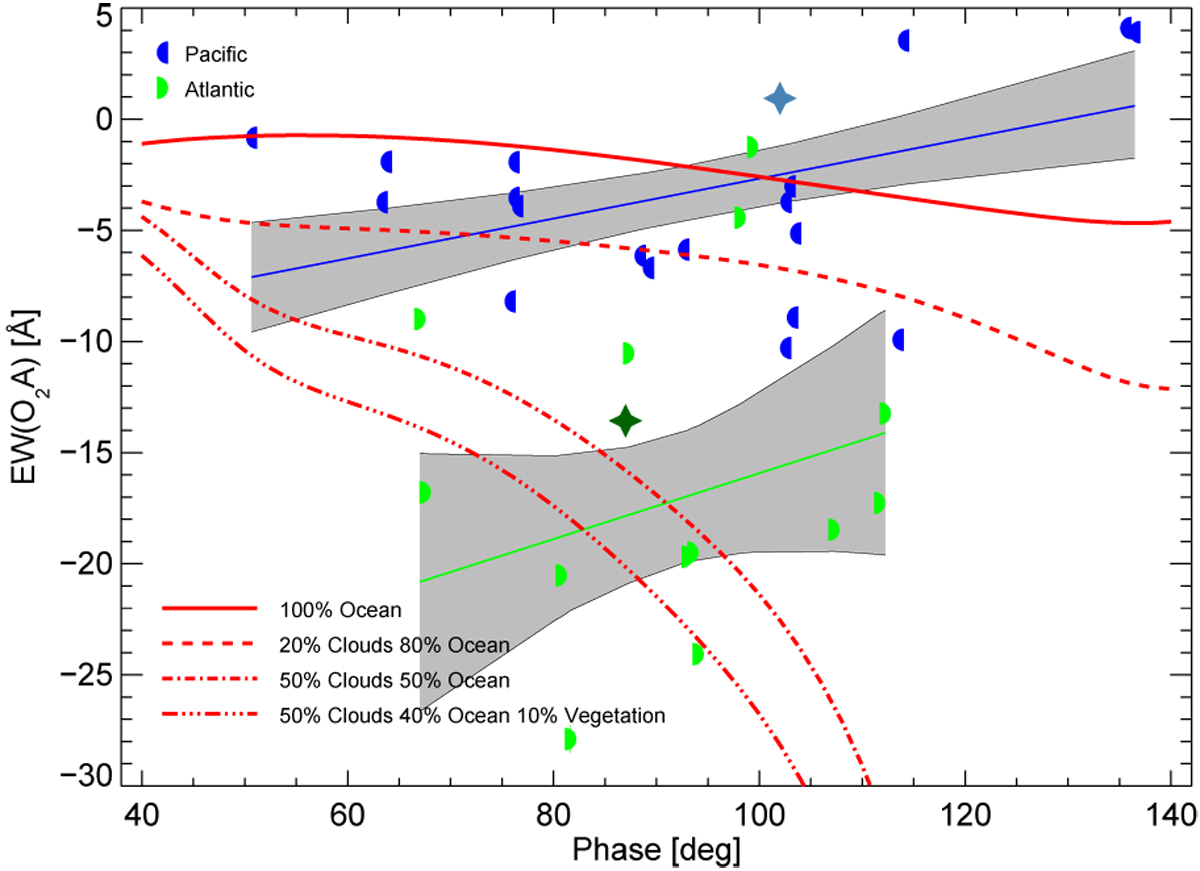
Equivalent width (EW) in the O2-A band as a function of phase angle α. The symbols indicate the different sceneries (Pacific and Atlantic). Full lines and gray areas indicate the linear regression and its errors. Both regression curves are distinct by ≈ 2σ from each other, and offset over the full range of phase angles covered. A very low probability found in a two-sample KS-test indicates that both samples are not drawn from the same underlying population. Red lines with different line styles refer to models of Stam (2008) and star symbols refer to the two models of Emde et al. (2017).
Current usage metrics show cumulative count of Article Views (full-text article views including HTML views, PDF and ePub downloads, according to the available data) and Abstracts Views on Vision4Press platform.
Data correspond to usage on the plateform after 2015. The current usage metrics is available 48-96 hours after online publication and is updated daily on week days.
Initial download of the metrics may take a while.