Fig. 11
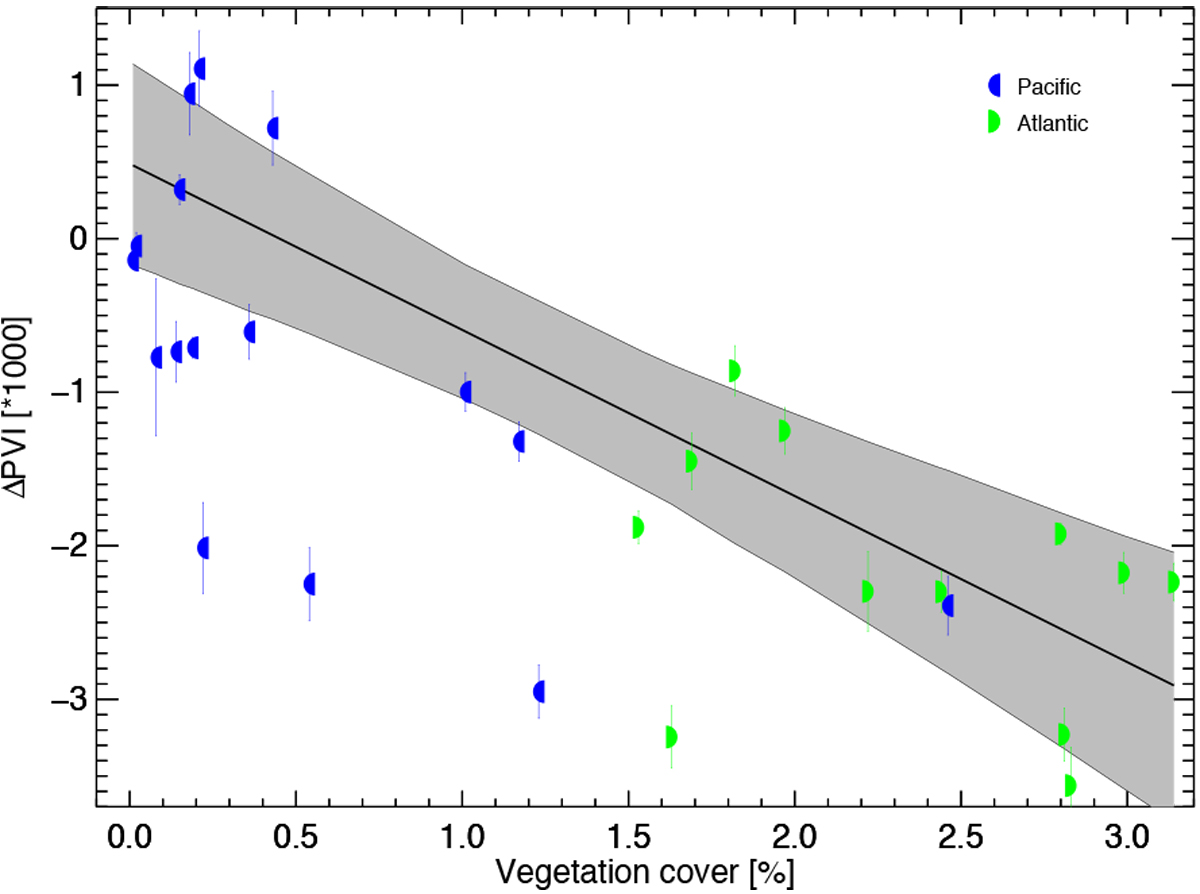
ΔPVI as a function of the actual vegetation cover observed. The actual vegetation cover has been calculated from NDVI values for each image pixel. Different symbols indicate the viewing sceneries (Pacific or Atlantic). The black line shows a linear regression fit with all the observations. Confidence bands of 1σ round the linear regression are shaded in gray. The anticorrelation of ΔPVI with the actual vegetation cover is strong, although outliers exist.
Current usage metrics show cumulative count of Article Views (full-text article views including HTML views, PDF and ePub downloads, according to the available data) and Abstracts Views on Vision4Press platform.
Data correspond to usage on the plateform after 2015. The current usage metrics is available 48-96 hours after online publication and is updated daily on week days.
Initial download of the metrics may take a while.