Fig. 10
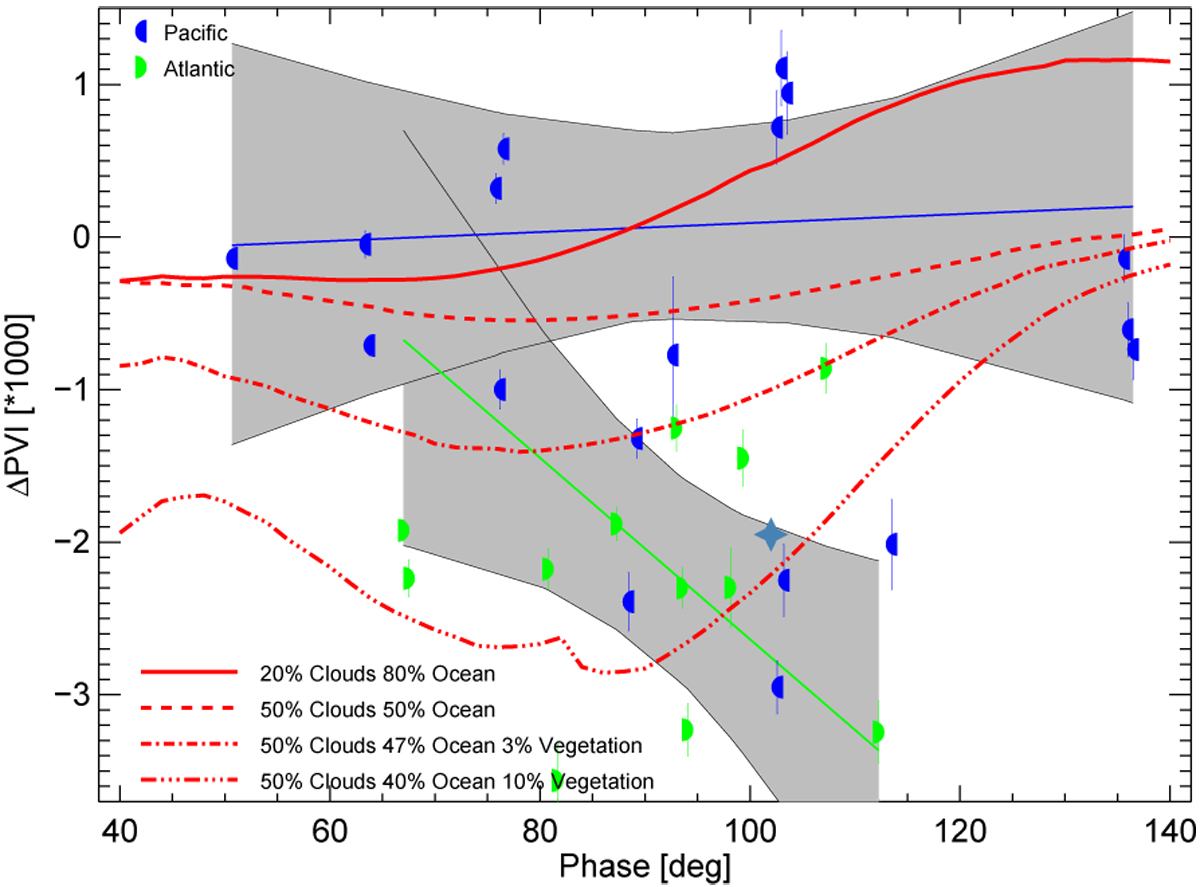
ΔPVI as a function of the phase angle with the symbols indicating the viewing sceneries (Pacific or Atlantic). The green and blue lines indicate the linear regression fit from all the observations of either scenery. Confidence bands of 1σ around the linear regression are shaded in gray for the two subsamples. While the Pacific side shows a very weak correlation with the phase angle, the population from the Atlantic exhibits decreasing ΔPVI with increasing phase angles. Both samples are statistically distinct according to a two-sample KS-test. Red lines indicate the ΔPVIs as derived from the models from Stam (2008). The star symbol indicates the ΔPVI as derived from the model for the B.4 from Emde et al. (2017); the value derived from the model for the A.3 dataset is −4.49, and falls outside the plot.
Current usage metrics show cumulative count of Article Views (full-text article views including HTML views, PDF and ePub downloads, according to the available data) and Abstracts Views on Vision4Press platform.
Data correspond to usage on the plateform after 2015. The current usage metrics is available 48-96 hours after online publication and is updated daily on week days.
Initial download of the metrics may take a while.