Free Access
Fig. 8
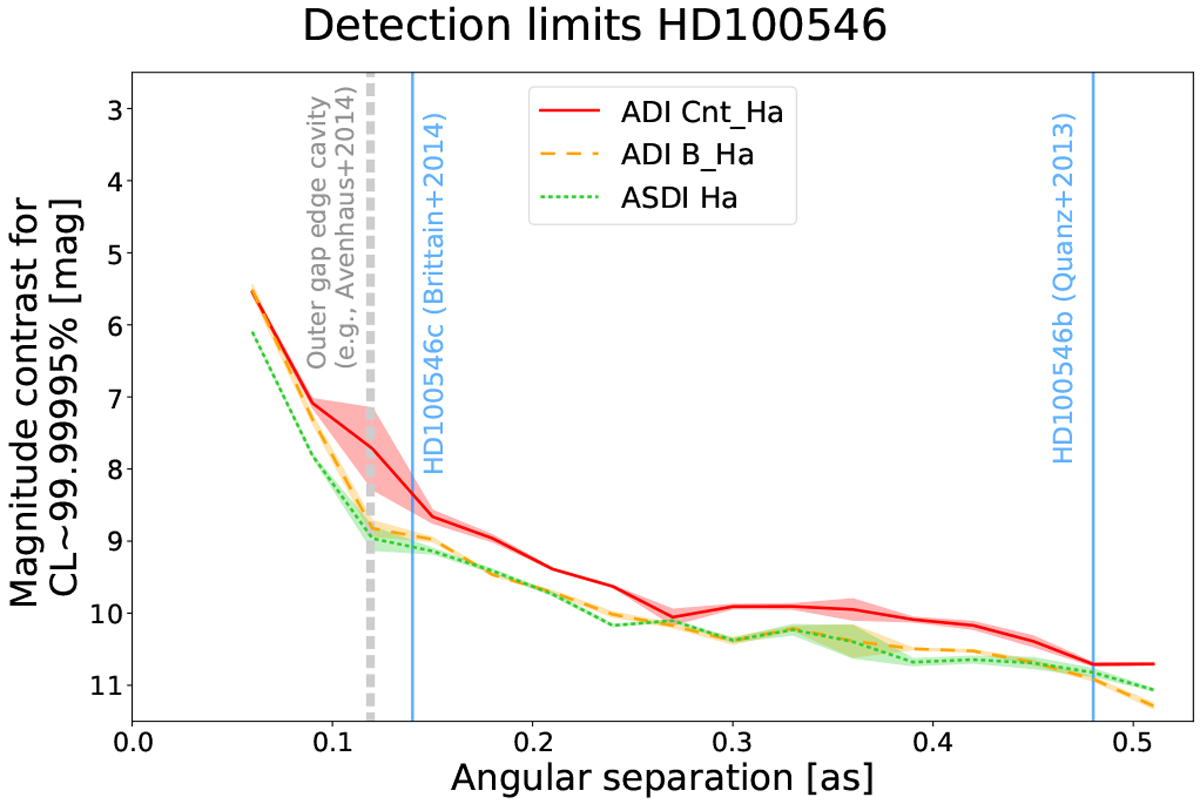
Contrast curves for HD100546. The gray dashed vertical line shows the separation of the outer gap edge cavity presented in Avenhaus et al. (2014a), while the solid blue lines indicate the separations of the forming planet candidates around HD100546 (Quanz et al. 2013a; Brittain et al. 2014).
Current usage metrics show cumulative count of Article Views (full-text article views including HTML views, PDF and ePub downloads, according to the available data) and Abstracts Views on Vision4Press platform.
Data correspond to usage on the plateform after 2015. The current usage metrics is available 48-96 hours after online publication and is updated daily on week days.
Initial download of the metrics may take a while.