Free Access
Fig. 2
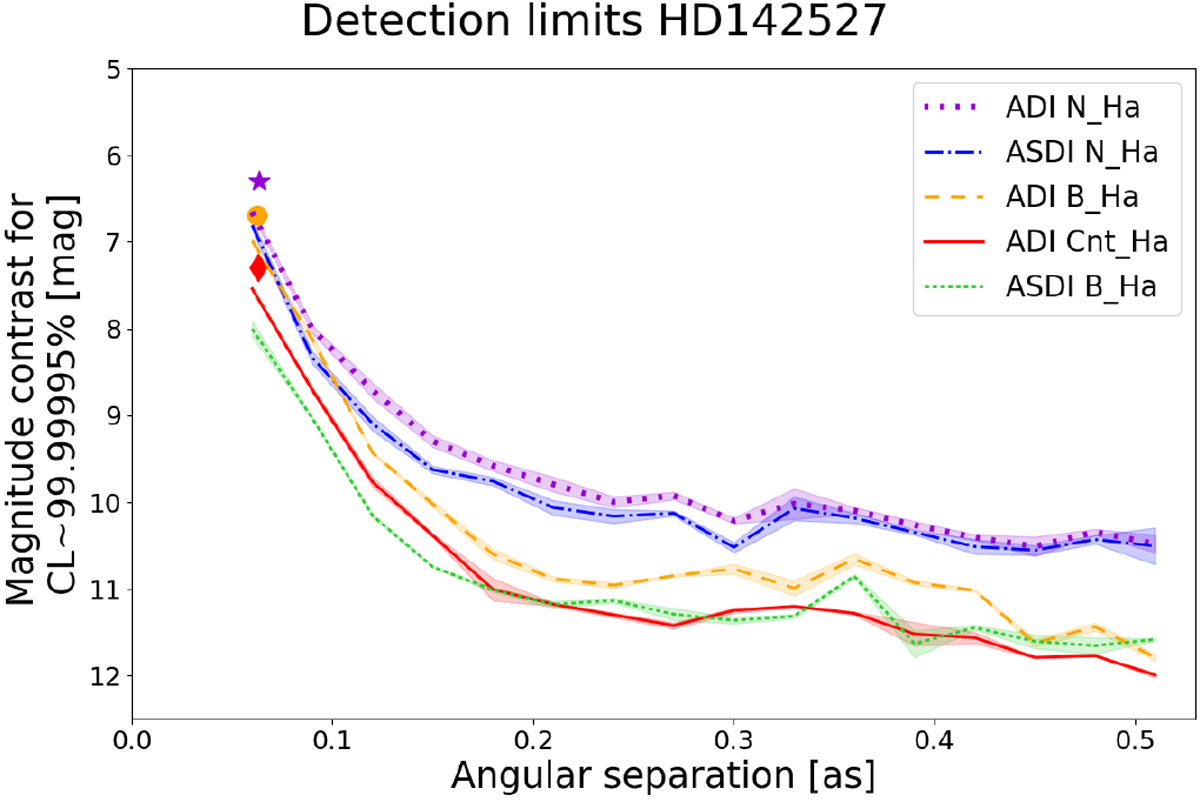
Contrast curves for HD142527. The colored shaded regions around each curve represent the standard deviation of the achieved contrast at the 6 azimuthal positions considered at each separation. The markers (red diamond, orange circle, and violet star) represent the contrast of HD142527 B.
Current usage metrics show cumulative count of Article Views (full-text article views including HTML views, PDF and ePub downloads, according to the available data) and Abstracts Views on Vision4Press platform.
Data correspond to usage on the plateform after 2015. The current usage metrics is available 48-96 hours after online publication and is updated daily on week days.
Initial download of the metrics may take a while.