Fig. 13
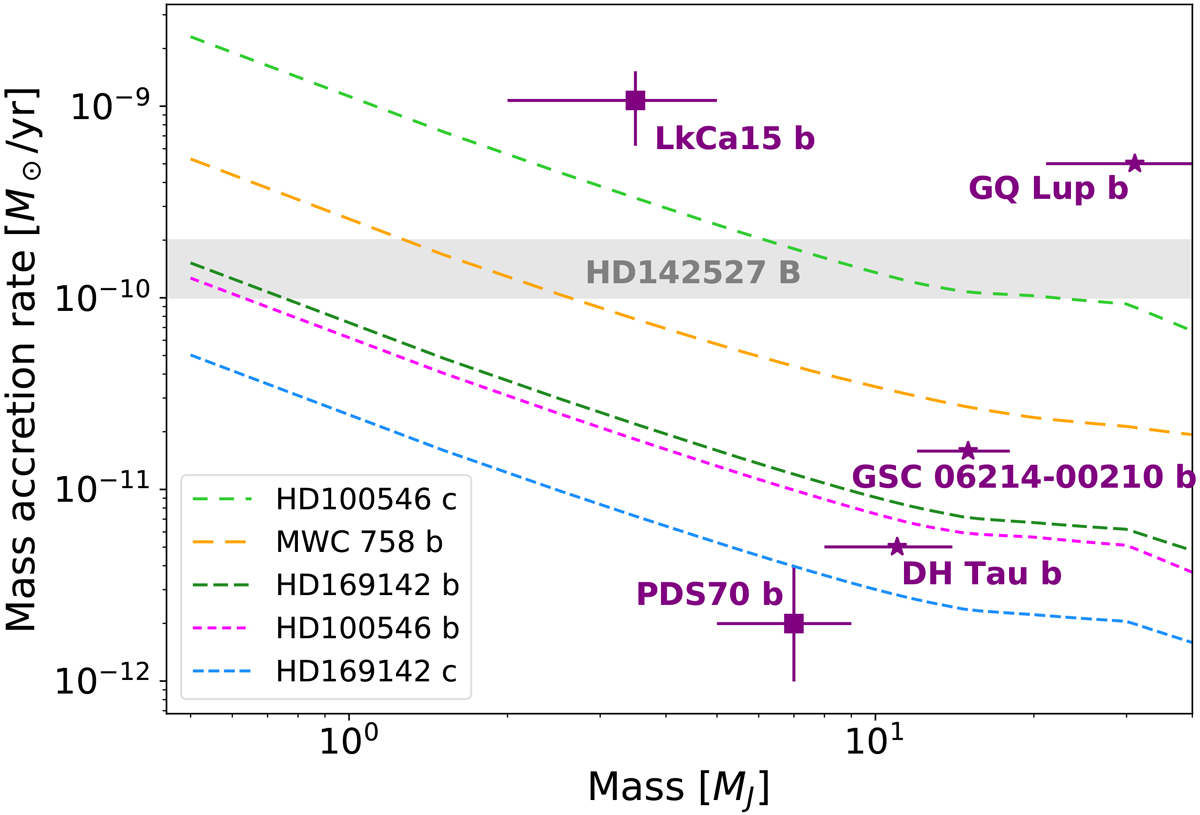
Mass accretion rate upper limits as a function of the planetary mass for all the candidate forming planets investigated in this work. The violet stars represent the values reported in Zhou et al. (2014), while the violet squares indicate PDS70 b (Wagner et al. 2018) and LkCa15 b (Sallum et al. 2015). The gray shaded area represents the mass accretion rate of HD142527 B and is shown for mass accretion rate comparisonpurposes only. Indeed, the mass of the object is much larger than what is reported on the x-axis of the plot.
Current usage metrics show cumulative count of Article Views (full-text article views including HTML views, PDF and ePub downloads, according to the available data) and Abstracts Views on Vision4Press platform.
Data correspond to usage on the plateform after 2015. The current usage metrics is available 48-96 hours after online publication and is updated daily on week days.
Initial download of the metrics may take a while.