Fig. 7.
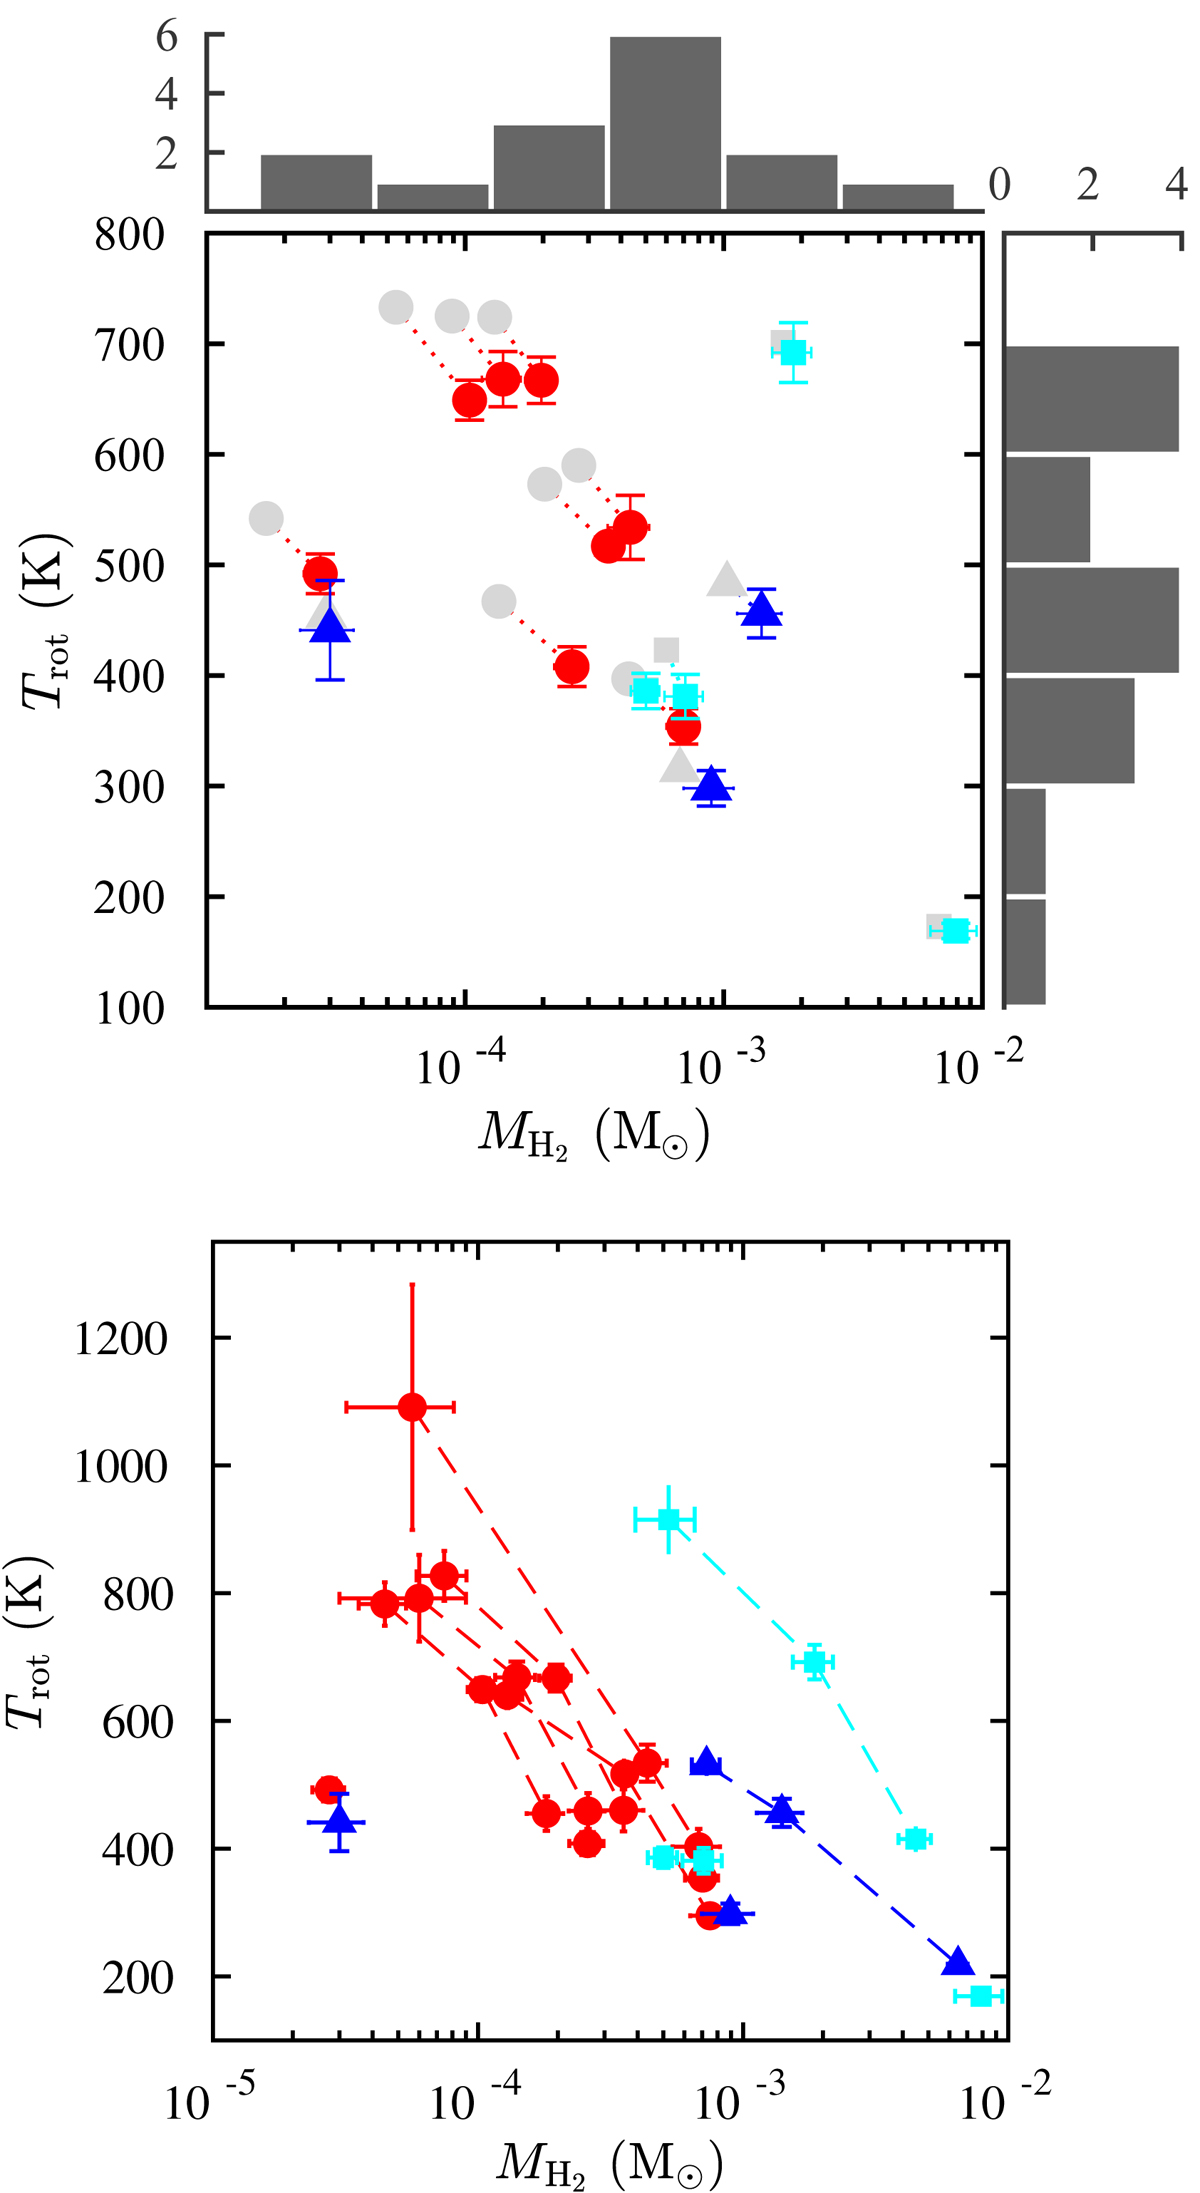
Summary of the RD results. Top panel: coloured symbols correspond to the opacity corrected values (single fit), which are connected by dotted lines to the corresponding uncorrected values in grey; on the sides we show the histograms of temperature and mass of the single fits; in the case of IRC+10216 we show weighted averages of four observations. Bottom panel: temperature and mass of the warm and hot components are connected by dashed lines for the same target (if applicable).
Current usage metrics show cumulative count of Article Views (full-text article views including HTML views, PDF and ePub downloads, according to the available data) and Abstracts Views on Vision4Press platform.
Data correspond to usage on the plateform after 2015. The current usage metrics is available 48-96 hours after online publication and is updated daily on week days.
Initial download of the metrics may take a while.