Fig. 5.
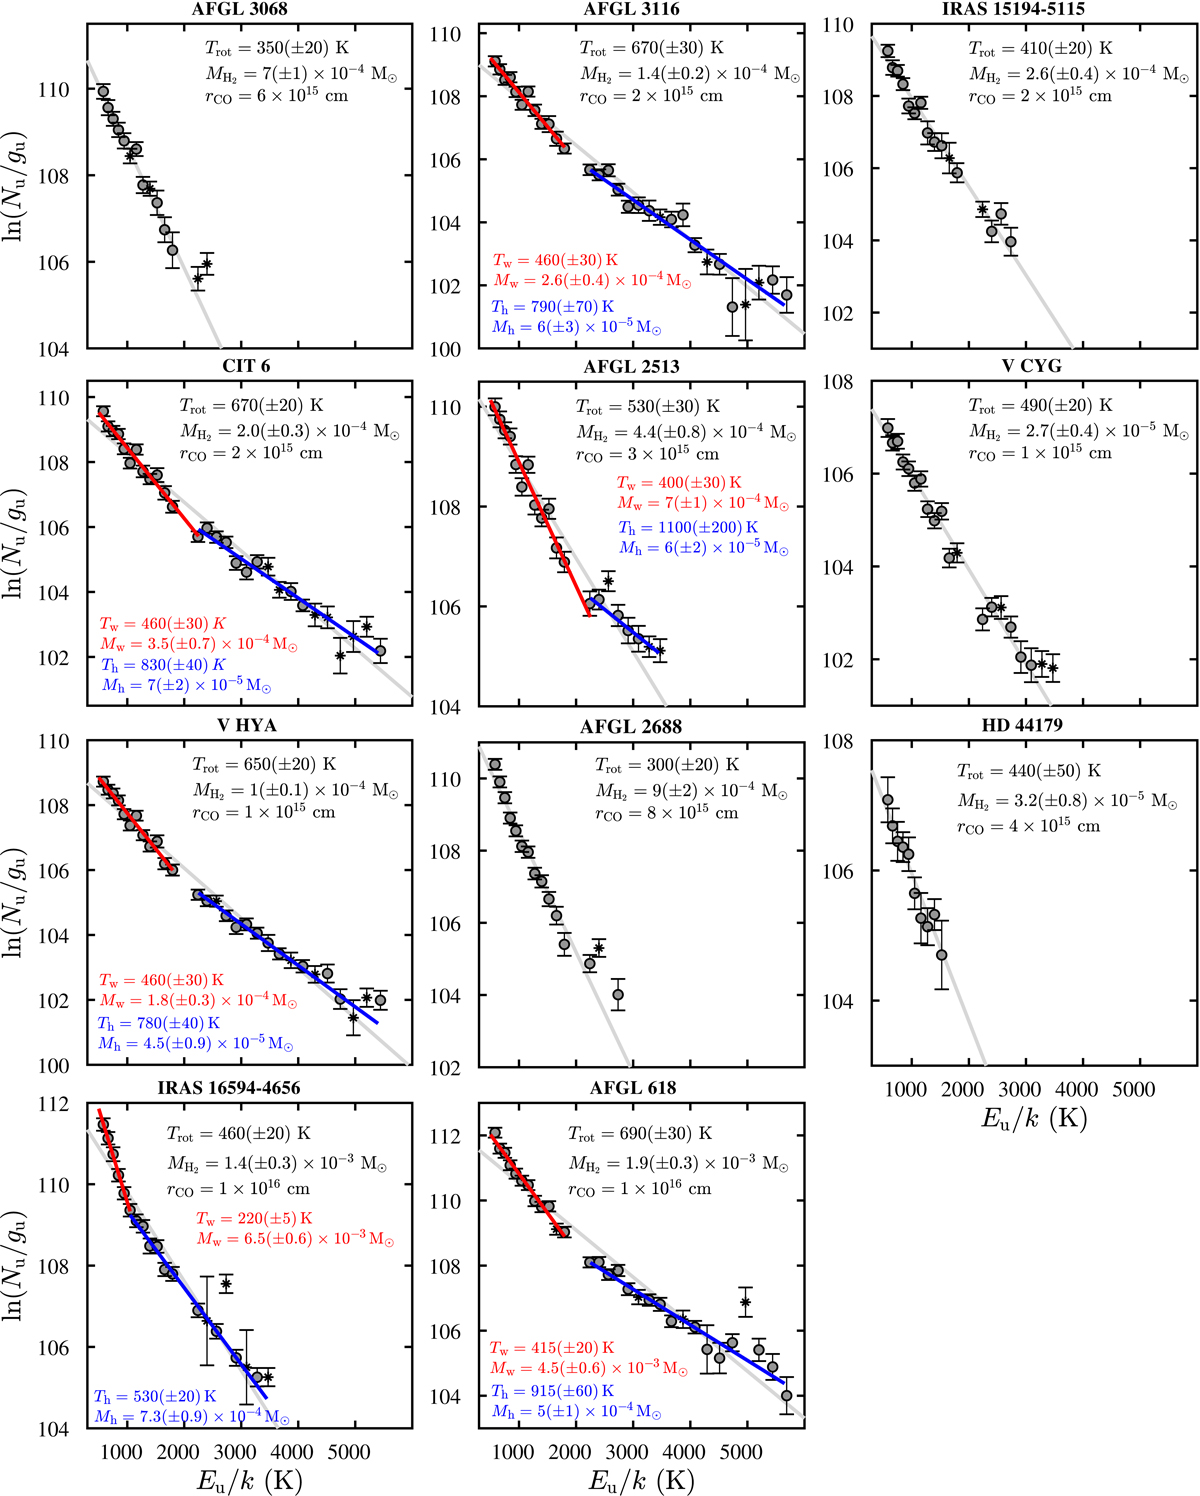
Rotational diagrams of the CO molecule. The grey line corresponds to a single least-squares fit to the full range of transitions from where a rotational temperature, Trot, and total gas mass, MH2, is computed. The characteristic radius of the CO-emitting volume (rCO) adopted is indicated. The red and blue lines correspond to a two-component model consisting of a “warm” and “hot” region, respectively. Asterisks indicate line blends that were excluded in the fit.
Current usage metrics show cumulative count of Article Views (full-text article views including HTML views, PDF and ePub downloads, according to the available data) and Abstracts Views on Vision4Press platform.
Data correspond to usage on the plateform after 2015. The current usage metrics is available 48-96 hours after online publication and is updated daily on week days.
Initial download of the metrics may take a while.