Fig. 3.
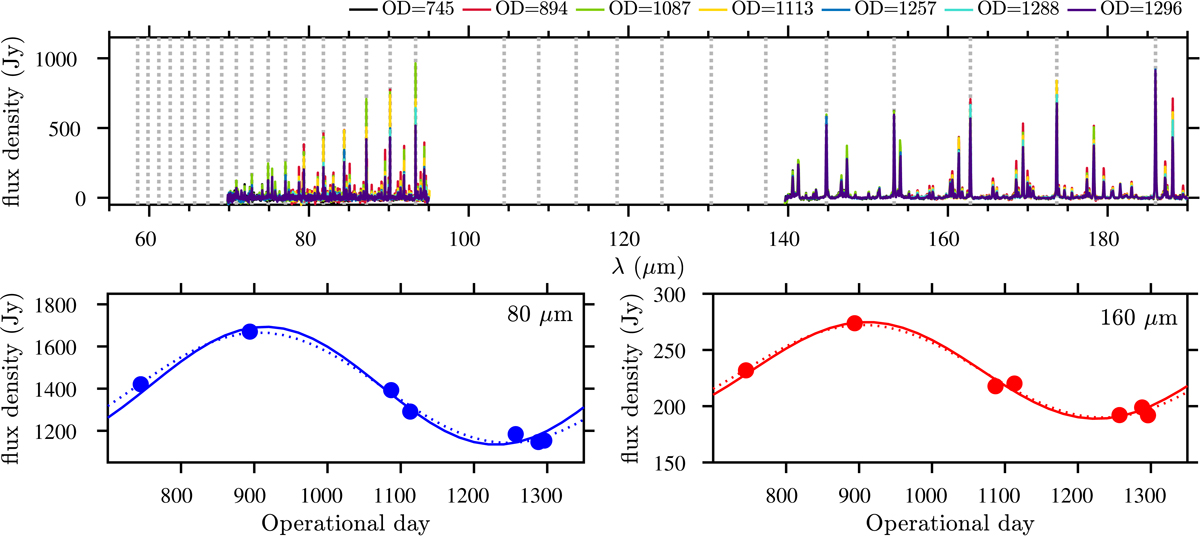
Line and continuum variability of IRC+10216 in the FIR. Top panel: continuum-subtracted spectra at different epochs (see also Fig. C.2); the dotted lines represent the CO transitions. Bottom panel: sine-wave fit to the continuum variability at two selected wavelengths for a fixed pulsation period of 630 days (solid lines) and a free-period fit corresponding to 680 and 660 days for the blue and red dashed curves, respectively.
Current usage metrics show cumulative count of Article Views (full-text article views including HTML views, PDF and ePub downloads, according to the available data) and Abstracts Views on Vision4Press platform.
Data correspond to usage on the plateform after 2015. The current usage metrics is available 48-96 hours after online publication and is updated daily on week days.
Initial download of the metrics may take a while.