Fig. A.1.
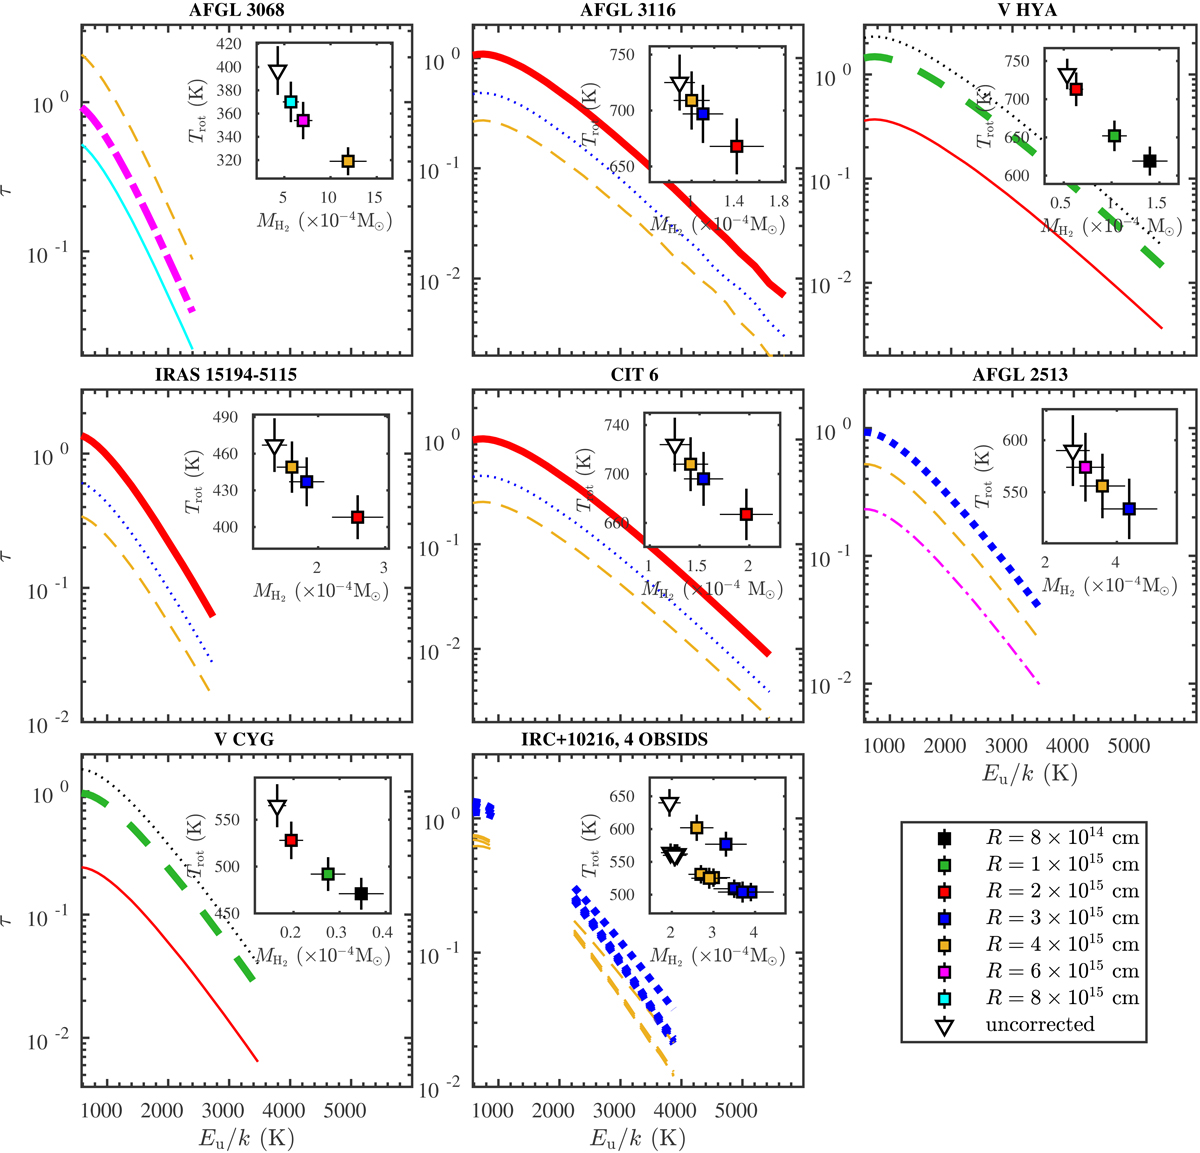
Optical depth at line centre (τ) as a function of the energy of the upper level (Eu). τ was computed for a range of radii; the characteristic radius adopted (rCO, Table B.1) is indicated with a thick line. In each panel, the inset shows the values of Trot and MH2 after the Cτ correction has been applied for the corresponding radii, along with the opacity-uncorrected results (open triangle).
Current usage metrics show cumulative count of Article Views (full-text article views including HTML views, PDF and ePub downloads, according to the available data) and Abstracts Views on Vision4Press platform.
Data correspond to usage on the plateform after 2015. The current usage metrics is available 48-96 hours after online publication and is updated daily on week days.
Initial download of the metrics may take a while.