Fig. 11.
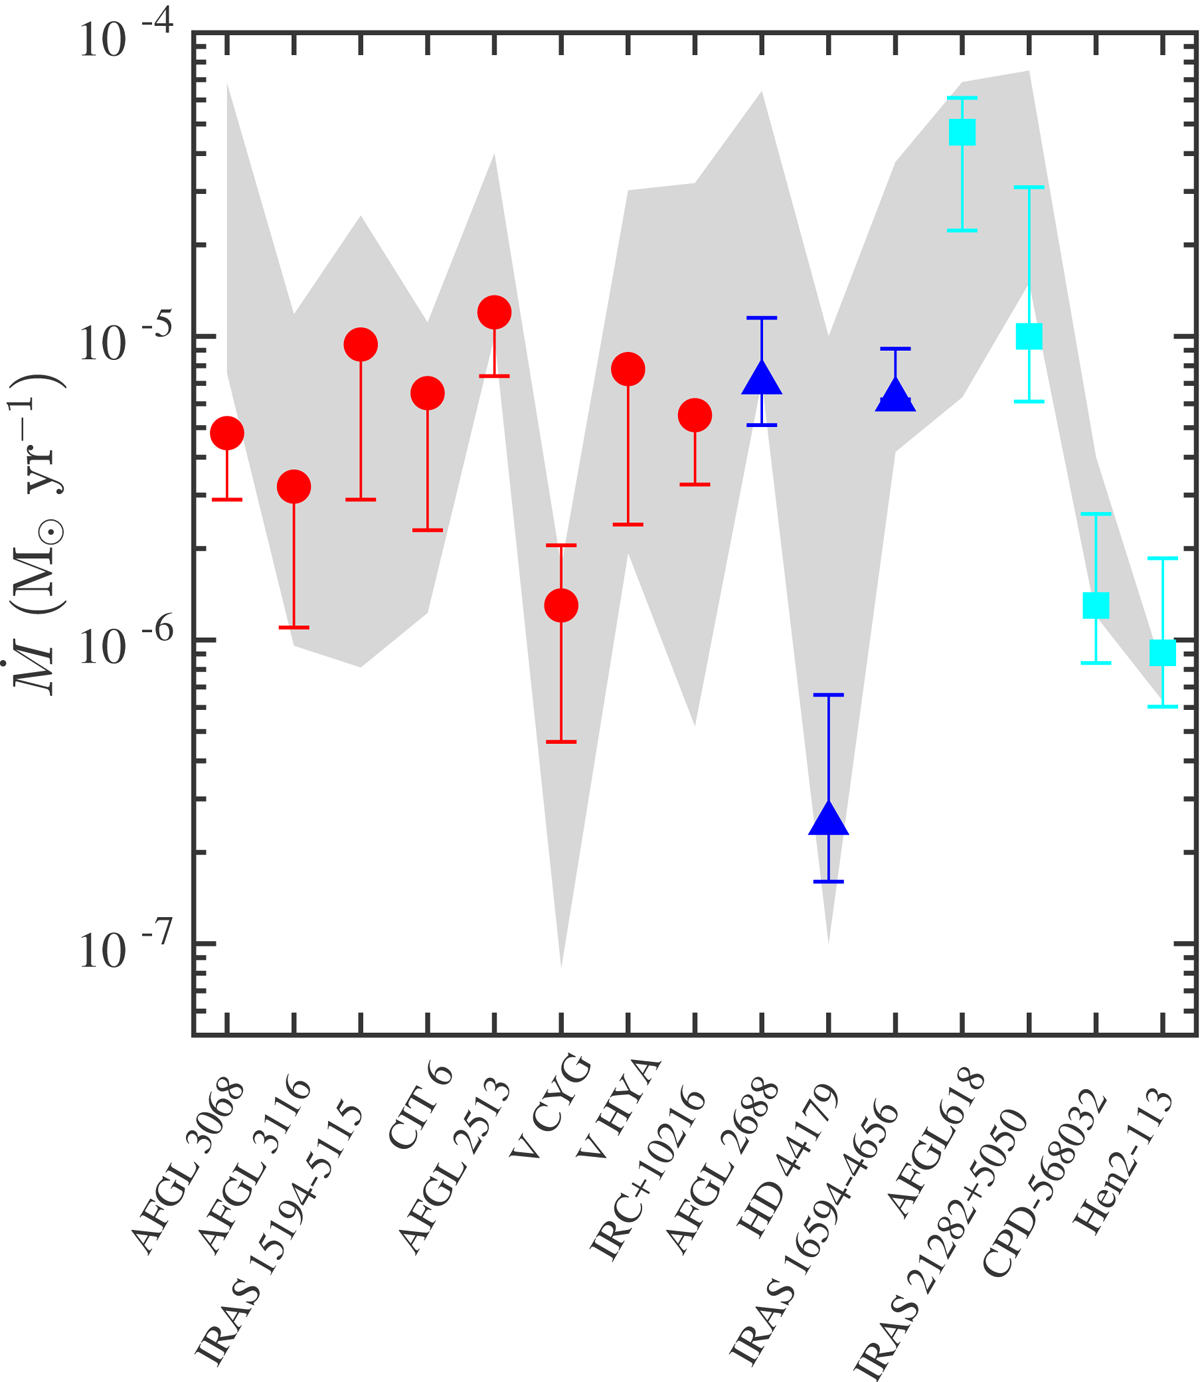
Comparison between the mass-loss rate in this work and the literature. The markers correspond to the representative radii listed in Table B.1 for each target and the error bars are mass-loss rates for a given range of radii. The shaded area delimits the range of values found in the literature scaled to the same parameters assumed in this work (see text).
Current usage metrics show cumulative count of Article Views (full-text article views including HTML views, PDF and ePub downloads, according to the available data) and Abstracts Views on Vision4Press platform.
Data correspond to usage on the plateform after 2015. The current usage metrics is available 48-96 hours after online publication and is updated daily on week days.
Initial download of the metrics may take a while.