Fig. 9.
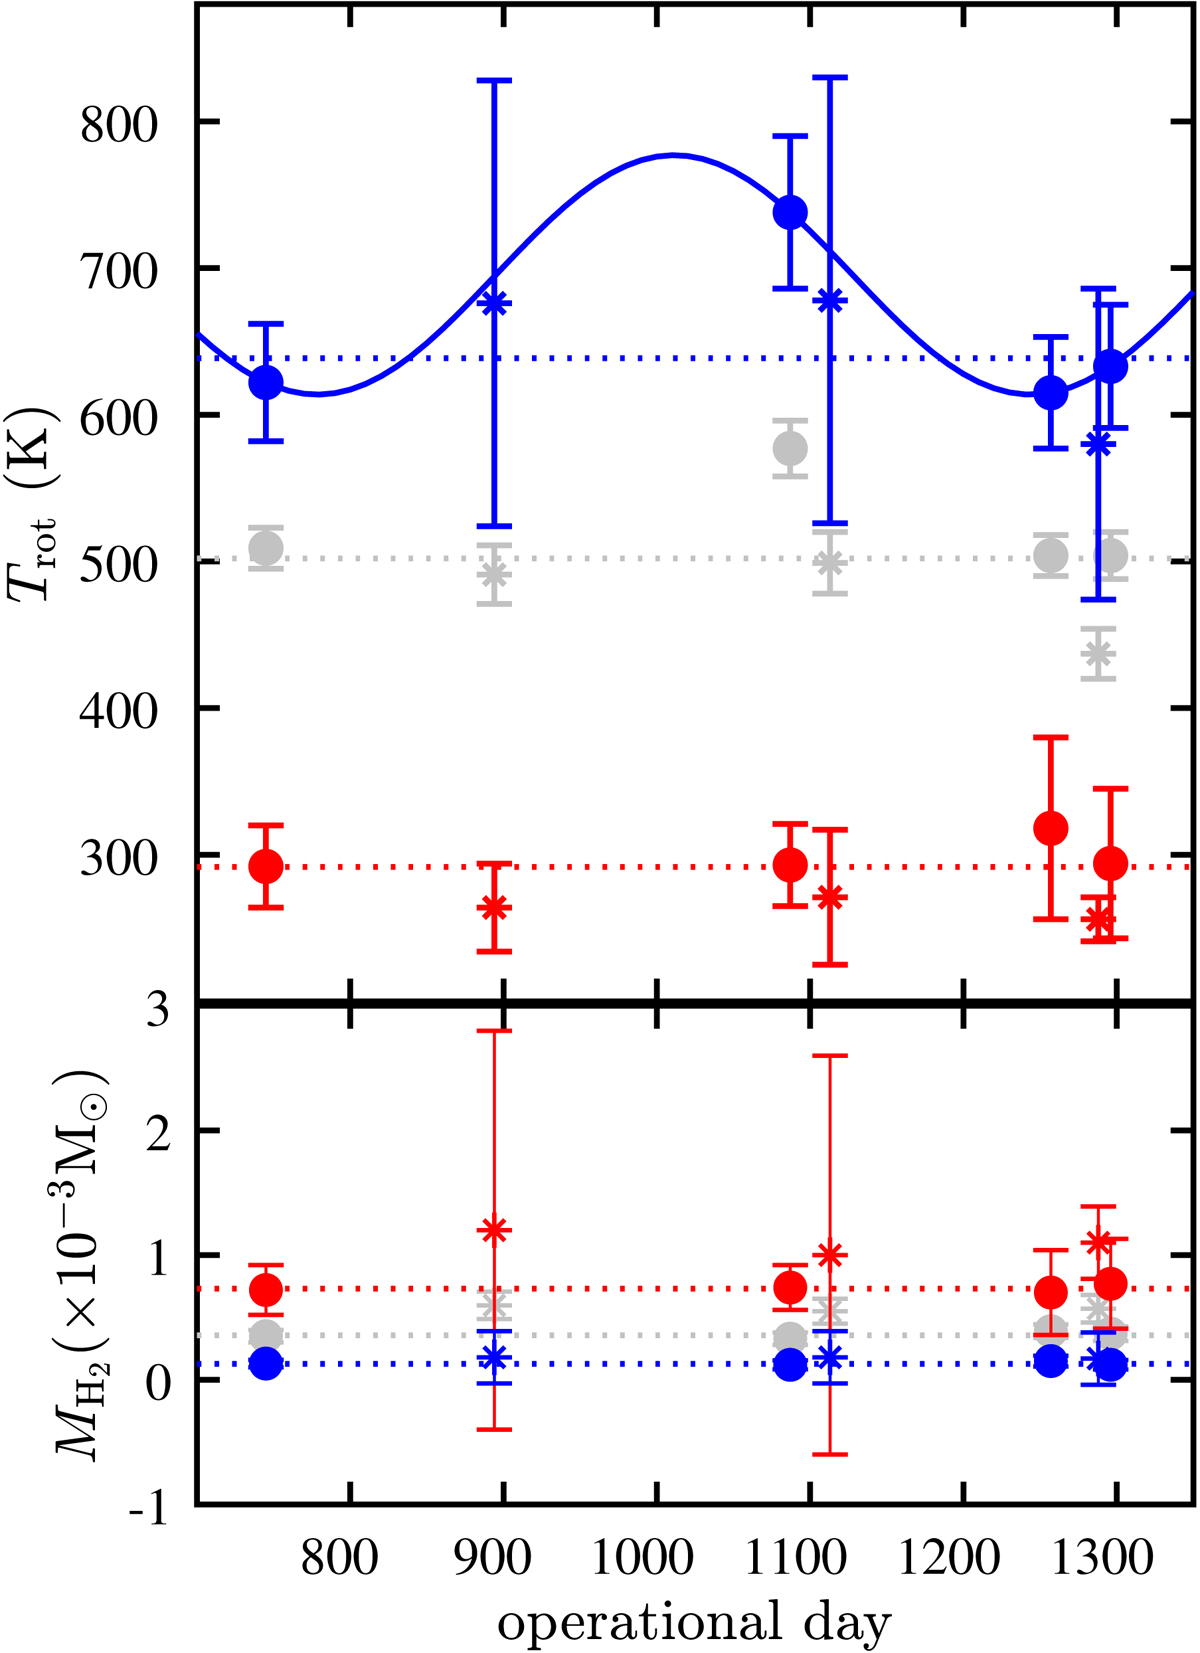
Rotational temperature and mass vs. operational day in IRC+10216. Top panel: sinusoidal fit to the Trotvariation with fixed period of 630 days (solid line). Bottom panel: total gas mass over time. In each panel, the dotted lines indicate the average of each component and the asterisks denote unused data points in the fit (see text). The colour code is the same as in Fig. 6.
Current usage metrics show cumulative count of Article Views (full-text article views including HTML views, PDF and ePub downloads, according to the available data) and Abstracts Views on Vision4Press platform.
Data correspond to usage on the plateform after 2015. The current usage metrics is available 48-96 hours after online publication and is updated daily on week days.
Initial download of the metrics may take a while.