Free Access
Fig. 1.
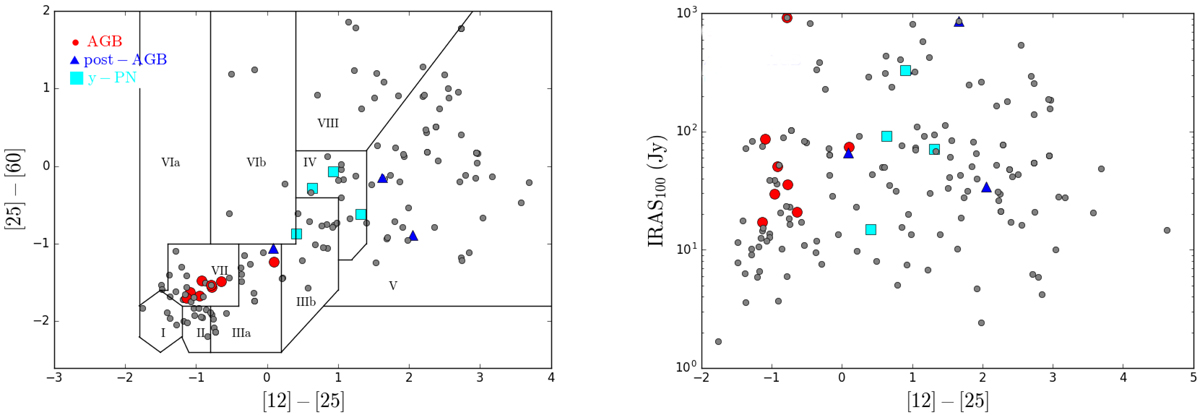
IRAS colour diagrams for the stars in the THROES catalogue. The colours are defined from the infrared fluxes at 12, 25, and 60 μm. The boxes in the left panel are those defined in van der Veen & Habing (1988), and the highlighted points correspond to the stars studied in this paper.
Current usage metrics show cumulative count of Article Views (full-text article views including HTML views, PDF and ePub downloads, according to the available data) and Abstracts Views on Vision4Press platform.
Data correspond to usage on the plateform after 2015. The current usage metrics is available 48-96 hours after online publication and is updated daily on week days.
Initial download of the metrics may take a while.