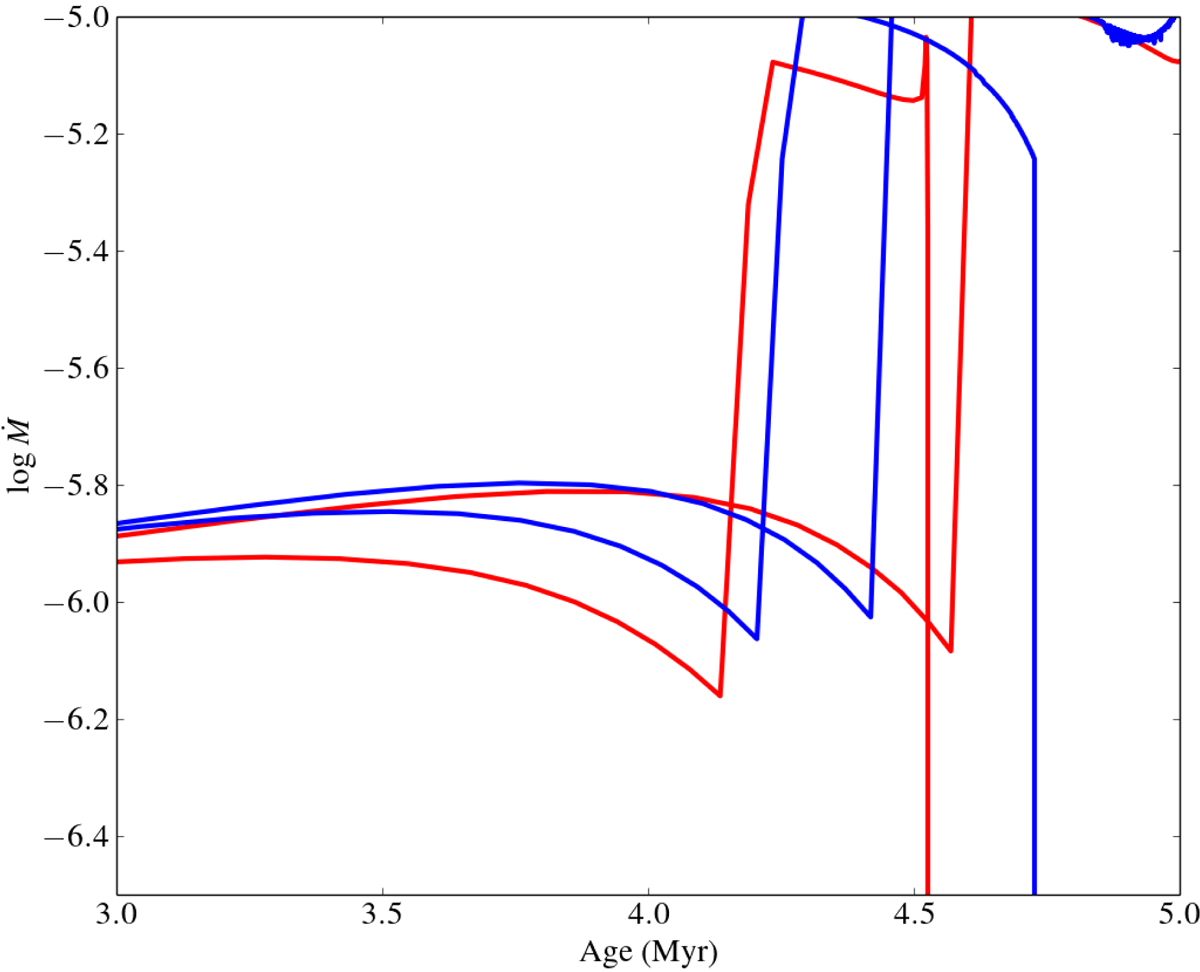
Fig. 2.

Mass-loss rate as a function of stellar age for comparison of rotationally induced mass loss. The red solid lines represent models with default MESA settings of rotationally induced Ṁ (see Eq. (1)), with an initial mass of 40 M⊙ and rotation rates of 100 km s−1 and 300 km s−1. All other processes have been set to default values to avoid conflict in our analysis. The dashed blue lines show the corresponding models with ξ = 0, for the same mass and rotation rates respectively.
Current usage metrics show cumulative count of Article Views (full-text article views including HTML views, PDF and ePub downloads, according to the available data) and Abstracts Views on Vision4Press platform.
Data correspond to usage on the plateform after 2015. The current usage metrics is available 48-96 hours after online publication and is updated daily on week days.
Initial download of the metrics may take a while.


