Fig. A.1.
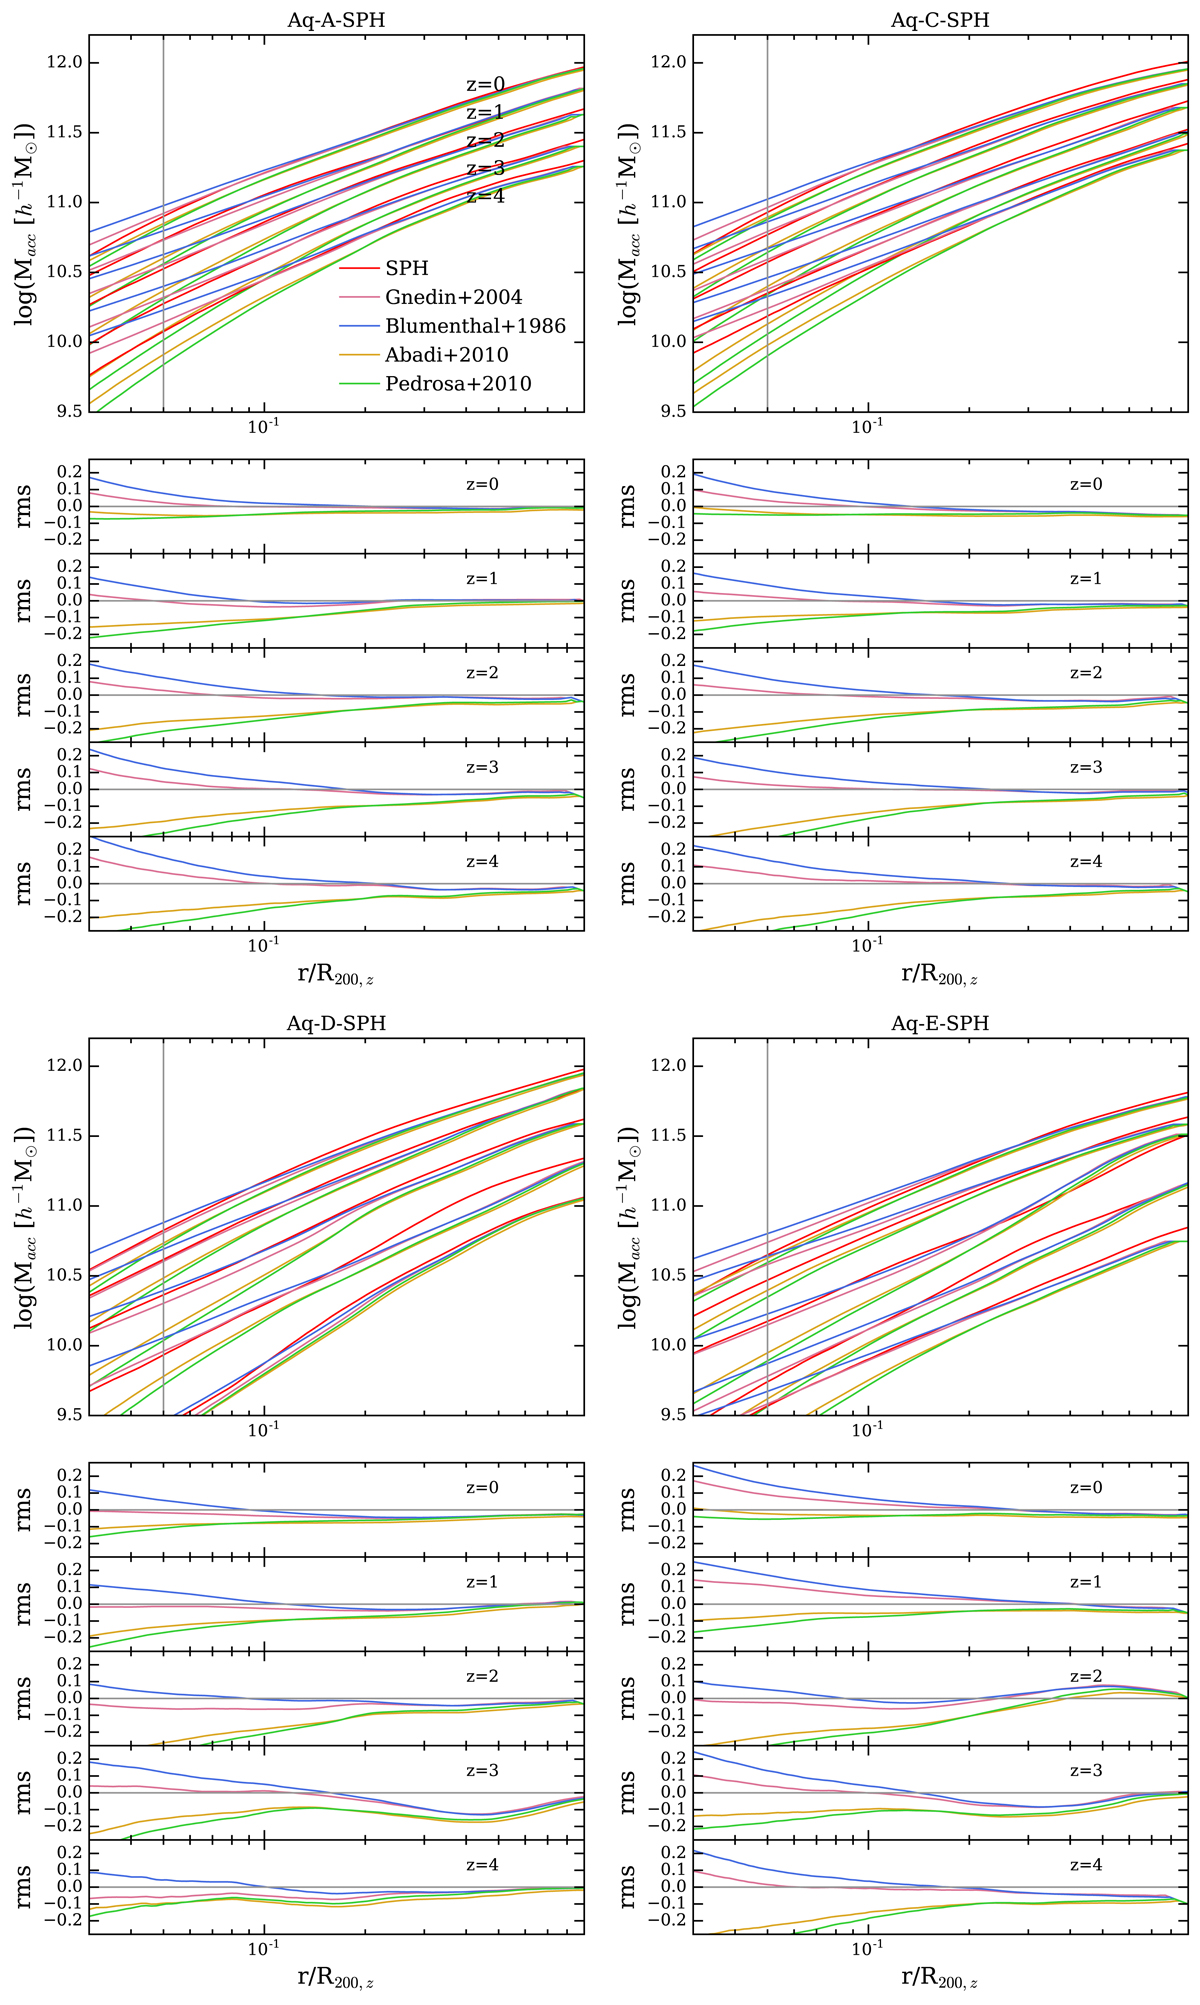
Mass distribution obtained from the four SPH Aquarius haloes, compared with four different halo contraction implementations at z = 0, 1, 2, 3, and 4 (from top to bottom for each halo). The AC models are Blumenthal et al. (1986; blue lines), Gnedin et al. (2004; pink lines). We also compare with the empirical models from Abadi et al. (2010; orange lines) and Pedrosa et al. (2010; green lines). The vertical grey line indicates the 5% virial radius at each redshift. We include the residuals between the mass distribution of the SPH haloes with each AC model.
Current usage metrics show cumulative count of Article Views (full-text article views including HTML views, PDF and ePub downloads, according to the available data) and Abstracts Views on Vision4Press platform.
Data correspond to usage on the plateform after 2015. The current usage metrics is available 48-96 hours after online publication and is updated daily on week days.
Initial download of the metrics may take a while.