Fig. 12.
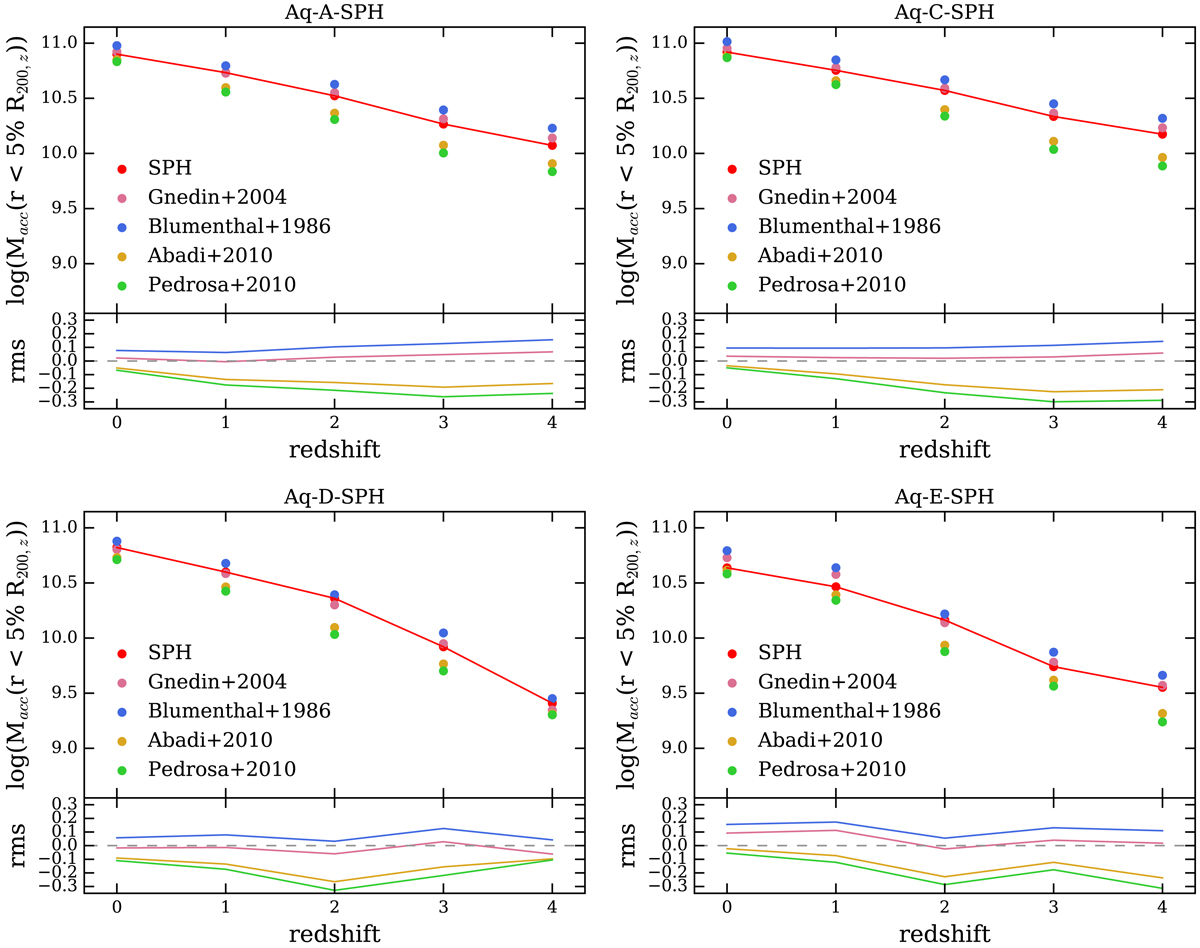
Mass enclosed within the five per cent of the virial radius (5%R200, z) at redshifts z = 0, 1, 2, 3 and 4. We show the results obtained from each halo (red points and lines) and those inferred from the AC implementations of Blumenthal et al. (1986; blue points), and Gnedin et al. (2004; pink points), and empirical models of Abadi et al. (2010; orange points) and Pedrosa et al. (2010; green points). We also present the rms obtained from the comparison between the models and the SPH haloes.
Current usage metrics show cumulative count of Article Views (full-text article views including HTML views, PDF and ePub downloads, according to the available data) and Abstracts Views on Vision4Press platform.
Data correspond to usage on the plateform after 2015. The current usage metrics is available 48-96 hours after online publication and is updated daily on week days.
Initial download of the metrics may take a while.