Fig. 11.
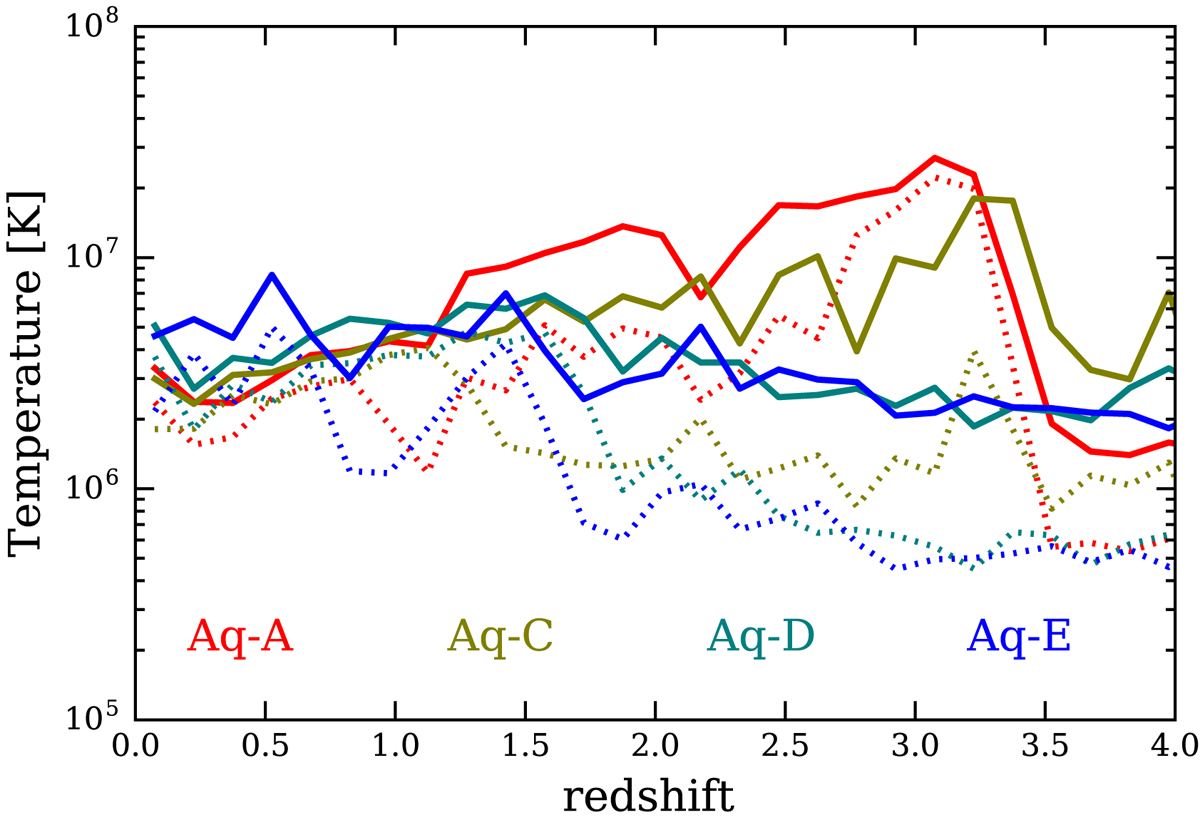
Mean temperature of the gas particles promoted to the hot phase as a function of redshift (for details regarding this criteria see Scannapieco et al. 2006). Dotted lines represent the mean temperature in each redshift, while filled lines belong to the mean temperature considering only those gas particles with temperature above T > 106 K.
Current usage metrics show cumulative count of Article Views (full-text article views including HTML views, PDF and ePub downloads, according to the available data) and Abstracts Views on Vision4Press platform.
Data correspond to usage on the plateform after 2015. The current usage metrics is available 48-96 hours after online publication and is updated daily on week days.
Initial download of the metrics may take a while.