Fig. 4.
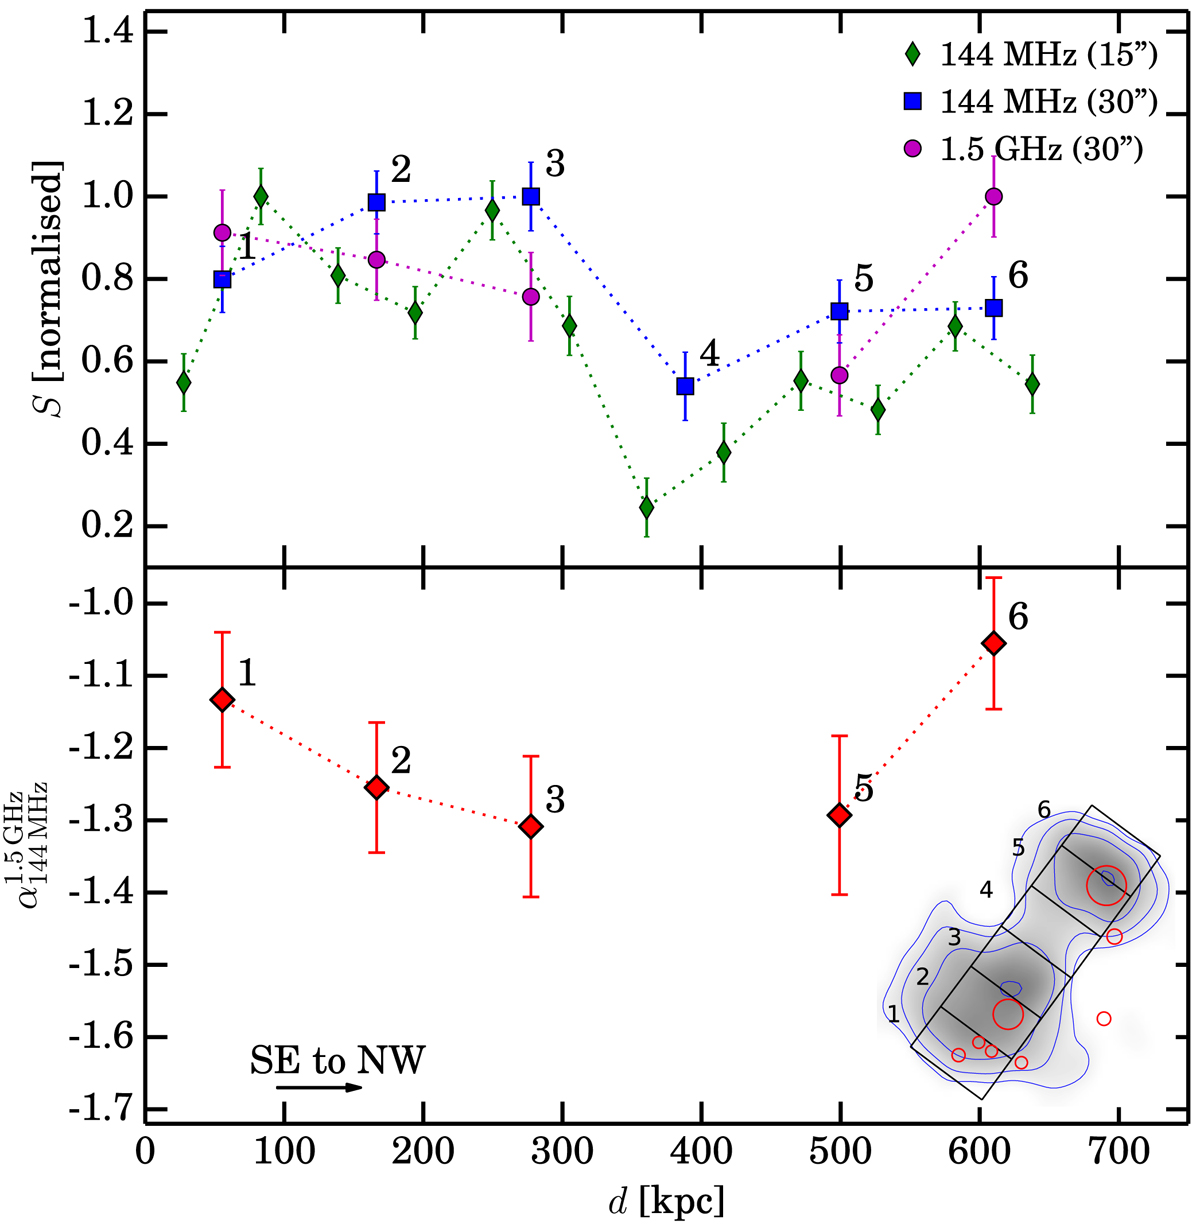
Surface brightness (top) and spectral index (bottom) profiles for the extended radio emission from A2146. The flux scale errors are not added to the total errors of the flux densities. The numbers next to the data points indicate the region numbers shown in overlaid image. The red circular regions at the locations of the subtracted compact sources are masked.
Current usage metrics show cumulative count of Article Views (full-text article views including HTML views, PDF and ePub downloads, according to the available data) and Abstracts Views on Vision4Press platform.
Data correspond to usage on the plateform after 2015. The current usage metrics is available 48-96 hours after online publication and is updated daily on week days.
Initial download of the metrics may take a while.