Fig. 3.
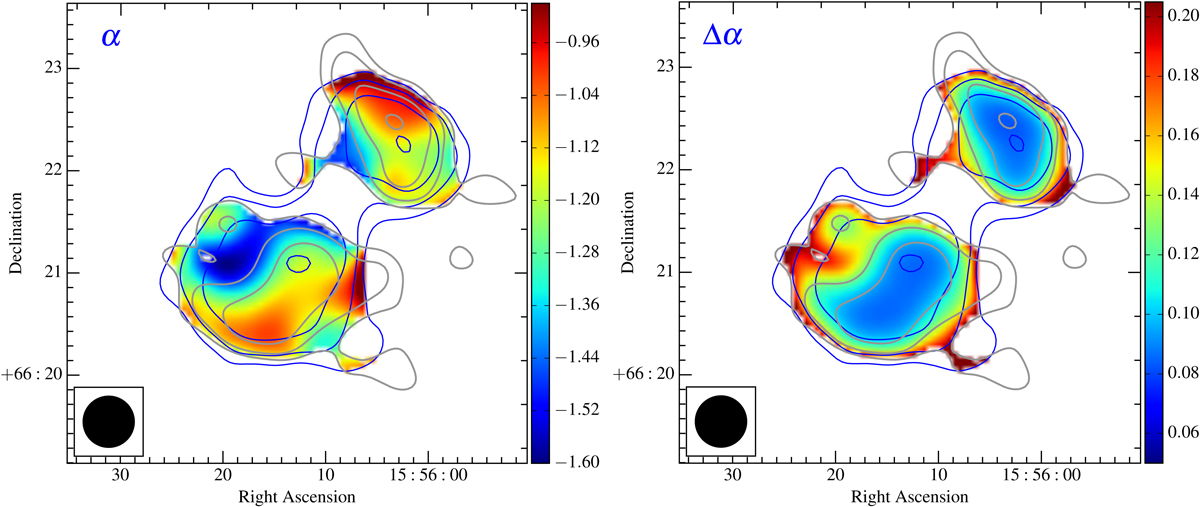
Left panel: spectral index map between 144 MHz − 1.5 GHz for the extended radio emission from A2146. Right panel: corresponding spectral index error map. The resolution of the maps is 30″. In both images, the LOFAR 144 MHz (blue) and VLA 1.5 GHz (grey) first contours are 2.5σ, where σ = 340 and 27 μJybeam−1 for the LOFAR 144 MHz and VLA 1.5 GHz data, respectively. The next contours are multiplied by ![]() .
.
Current usage metrics show cumulative count of Article Views (full-text article views including HTML views, PDF and ePub downloads, according to the available data) and Abstracts Views on Vision4Press platform.
Data correspond to usage on the plateform after 2015. The current usage metrics is available 48-96 hours after online publication and is updated daily on week days.
Initial download of the metrics may take a while.