Fig. 6.
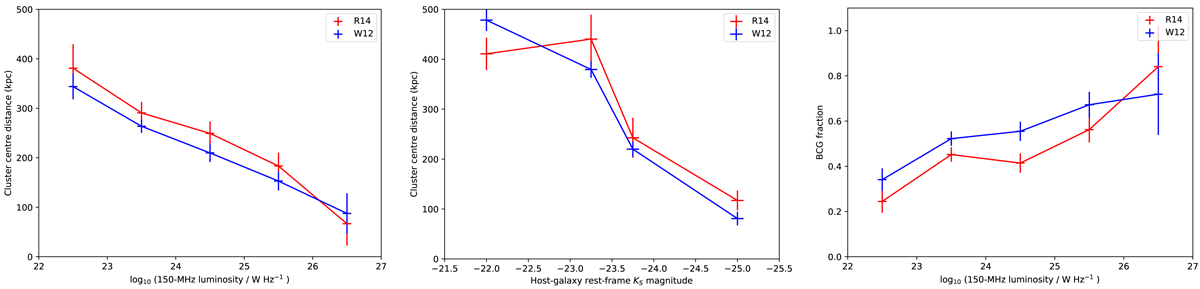
Left: distance of matched AGN from the cluster centre, as a function of 150 MHz luminosity, for the R14 catalogue (red) and the W12 catalogue (blue). Middle: as for the left-hand plot, but as a function of rest-frame KS magnitude. Right: fraction of AGN associated with groups/clusters that are hosted by the cluster centre galaxy (BCG) as a function of radio luminosity (colours as for left panel).
Current usage metrics show cumulative count of Article Views (full-text article views including HTML views, PDF and ePub downloads, according to the available data) and Abstracts Views on Vision4Press platform.
Data correspond to usage on the plateform after 2015. The current usage metrics is available 48-96 hours after online publication and is updated daily on week days.
Initial download of the metrics may take a while.