Fig. 5.
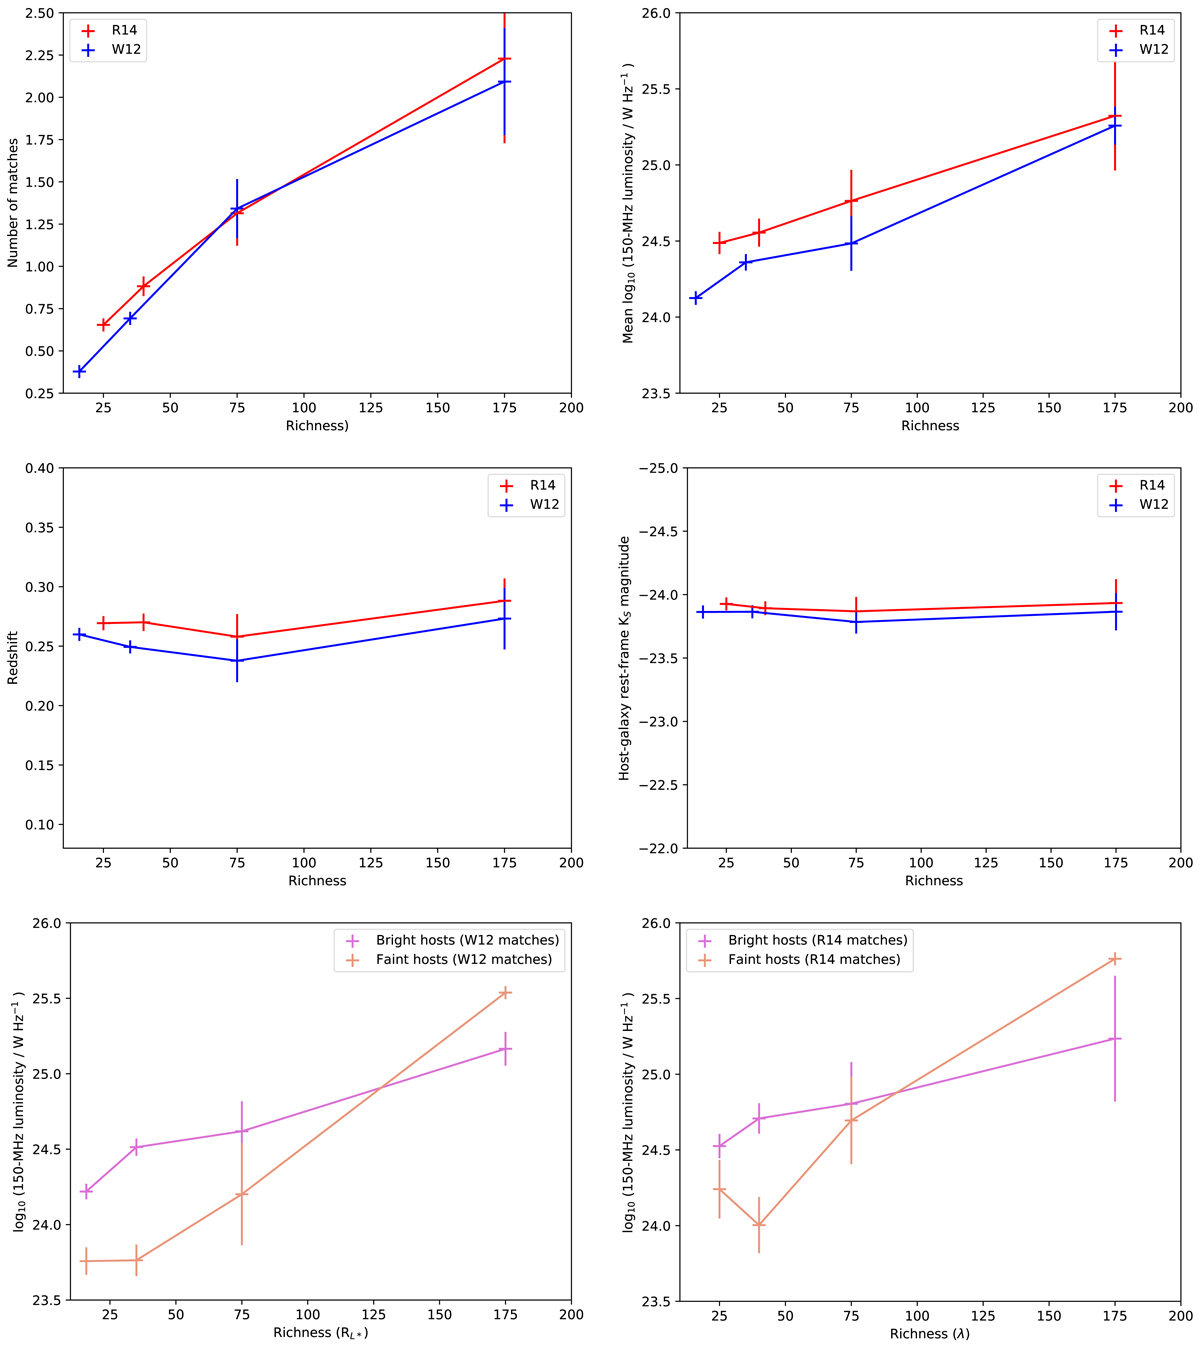
AGN properties of the cluster population. Top: mean number of AGN matches per cluster (left) and mean 150 MHz radio luminosity of the brightest associated AGN (right) as a function of cluster richness. Middle panel: the relationship of richness with redshift (left) and host-galaxy KS magnitude (right) for the same richness bins as the top panel. Bottom: mean radio luminosity versus richness as plotted in the top panel, but separated into two bins of host-galaxy magnitude (pink corresponding to −26 < KS < −23.5 and orange corresponding to −23.5 < KS < −21.0, where −23.5 is the median value.
Current usage metrics show cumulative count of Article Views (full-text article views including HTML views, PDF and ePub downloads, according to the available data) and Abstracts Views on Vision4Press platform.
Data correspond to usage on the plateform after 2015. The current usage metrics is available 48-96 hours after online publication and is updated daily on week days.
Initial download of the metrics may take a while.