Fig. 3.
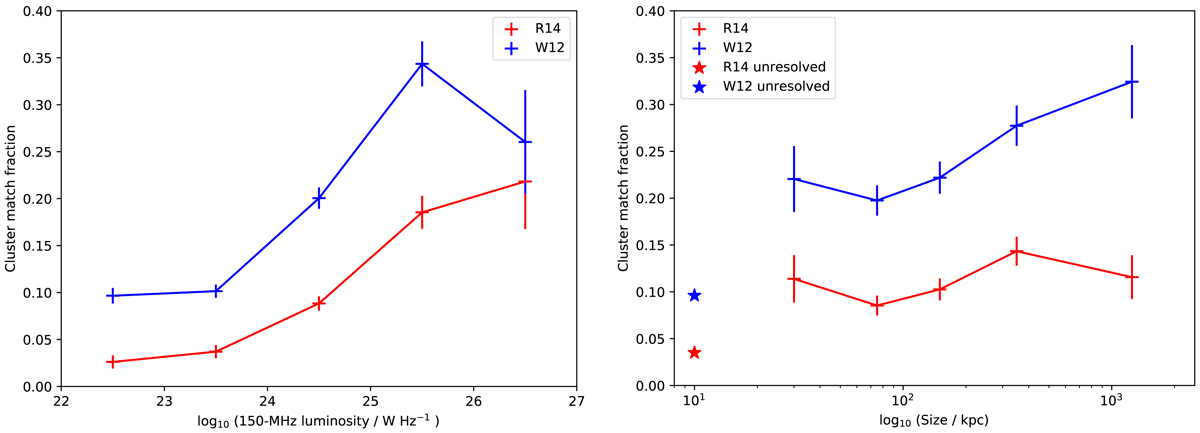
Cluster association fraction (i.e. the fraction of AGN with a group/cluster match) for the AGN sample, as a function of 150 MHz luminosity (left) and source physical size (right). Red and blue indicate the R14 and W12 catalogues, respectively, and for the righthand plot stars indicate the mean association fraction for all unresolved sources.
Current usage metrics show cumulative count of Article Views (full-text article views including HTML views, PDF and ePub downloads, according to the available data) and Abstracts Views on Vision4Press platform.
Data correspond to usage on the plateform after 2015. The current usage metrics is available 48-96 hours after online publication and is updated daily on week days.
Initial download of the metrics may take a while.