Fig. 2.
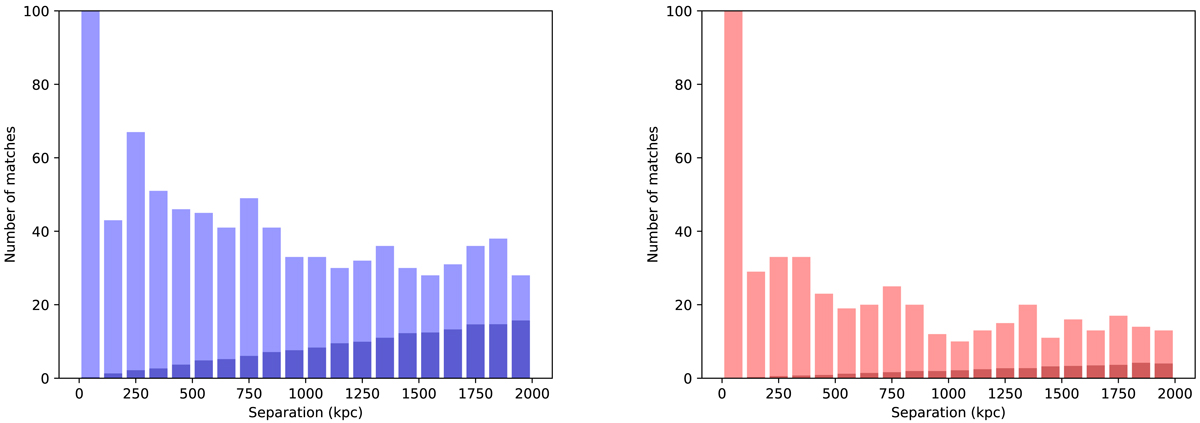
Separation distribution for cross-matched catalogue and for spurious matches from cross-matching with randomized catalogues for the Wen et al. (2012) catalogue (left; blue and dark blue) and Rykoff et al. (2014) catalogue (right; red and dark red). Note that the y axis is cropped to show the distribution at large distances: the bin encompassing zero separation in both catalogues extends to much higher values (630 for the left-hand and 232 for the right-hand panel) – these are sources for which the AGN host and cluster centre galaxy are the same.
Current usage metrics show cumulative count of Article Views (full-text article views including HTML views, PDF and ePub downloads, according to the available data) and Abstracts Views on Vision4Press platform.
Data correspond to usage on the plateform after 2015. The current usage metrics is available 48-96 hours after online publication and is updated daily on week days.
Initial download of the metrics may take a while.