Fig. 3.
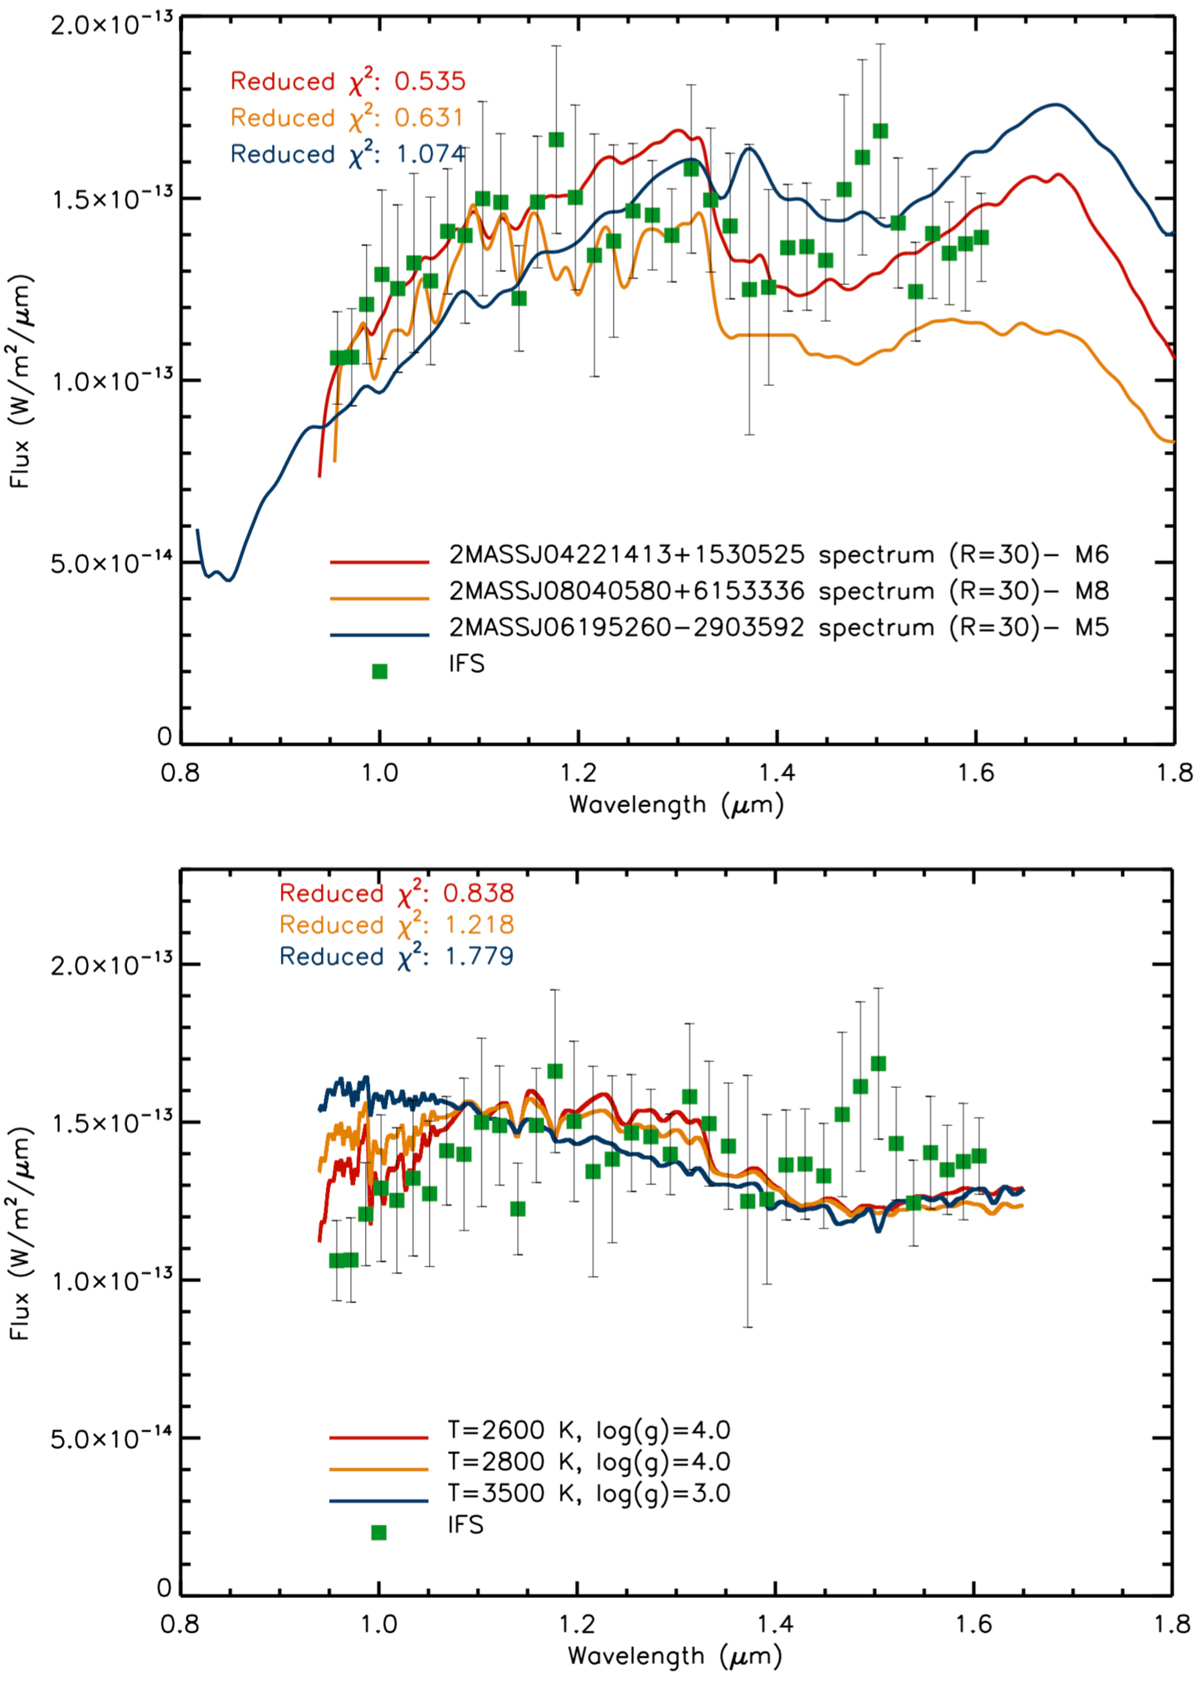
Top panel: extracted spectrum for HD 142527B (green squares) compared with the three best-fit spectra (red, orange, and blue solid lines) from the Allers & Liu (2013) obtained from the data taken on the night of May 13, 2015. Bottom panel: same as the top panel, but compared with the three best-fit models (red, orange, and blue solid lines) from the BT-Settl library Allard (2014).
Current usage metrics show cumulative count of Article Views (full-text article views including HTML views, PDF and ePub downloads, according to the available data) and Abstracts Views on Vision4Press platform.
Data correspond to usage on the plateform after 2015. The current usage metrics is available 48-96 hours after online publication and is updated daily on week days.
Initial download of the metrics may take a while.