Fig. 9.
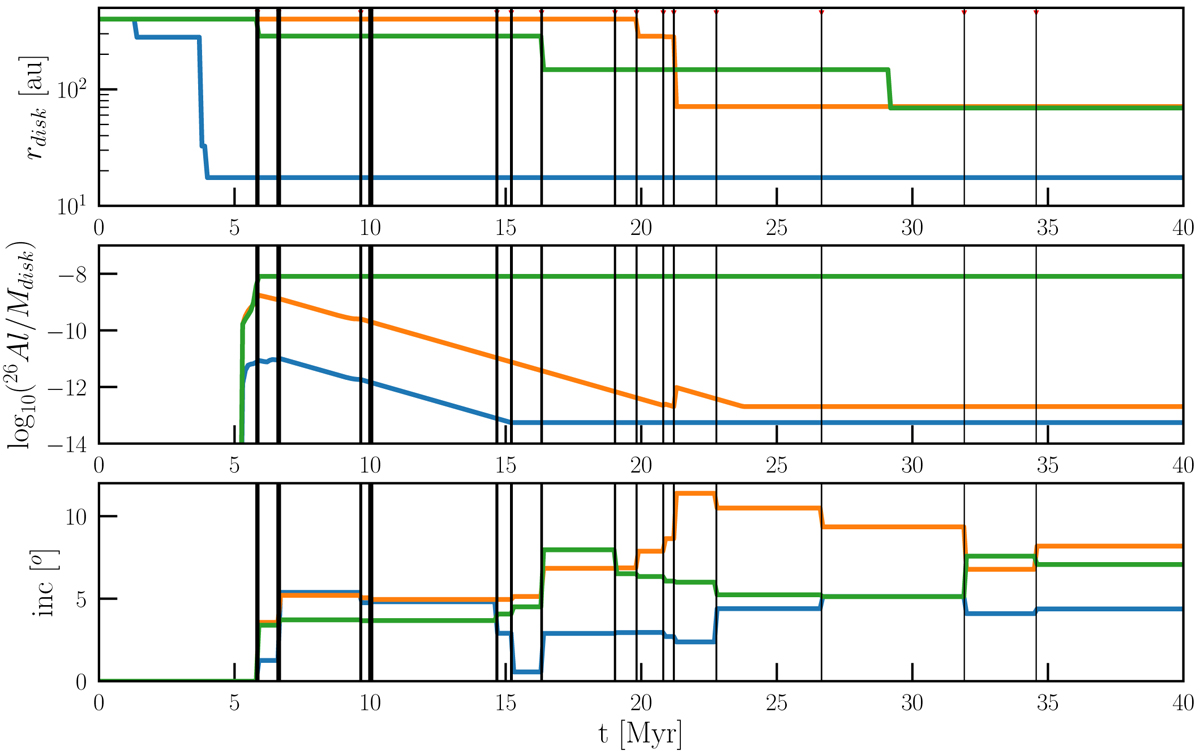
Example of the evolution of three (out of seven solar-system equivalent systems) stars in one particular simulation for N = 2500 and rvir = 0.75 pc towards a high value of 𝒮eqiv. The coloured lines (green, orange and blue) each identify the evolution of one star in time. The vertical lines identify the moments when supernova are produced in the cluster; the thickness of these lines is proportional to the amount of mass that was injected in the supernova shell.
Current usage metrics show cumulative count of Article Views (full-text article views including HTML views, PDF and ePub downloads, according to the available data) and Abstracts Views on Vision4Press platform.
Data correspond to usage on the plateform after 2015. The current usage metrics is available 48-96 hours after online publication and is updated daily on week days.
Initial download of the metrics may take a while.