Free Access
Fig. 7.
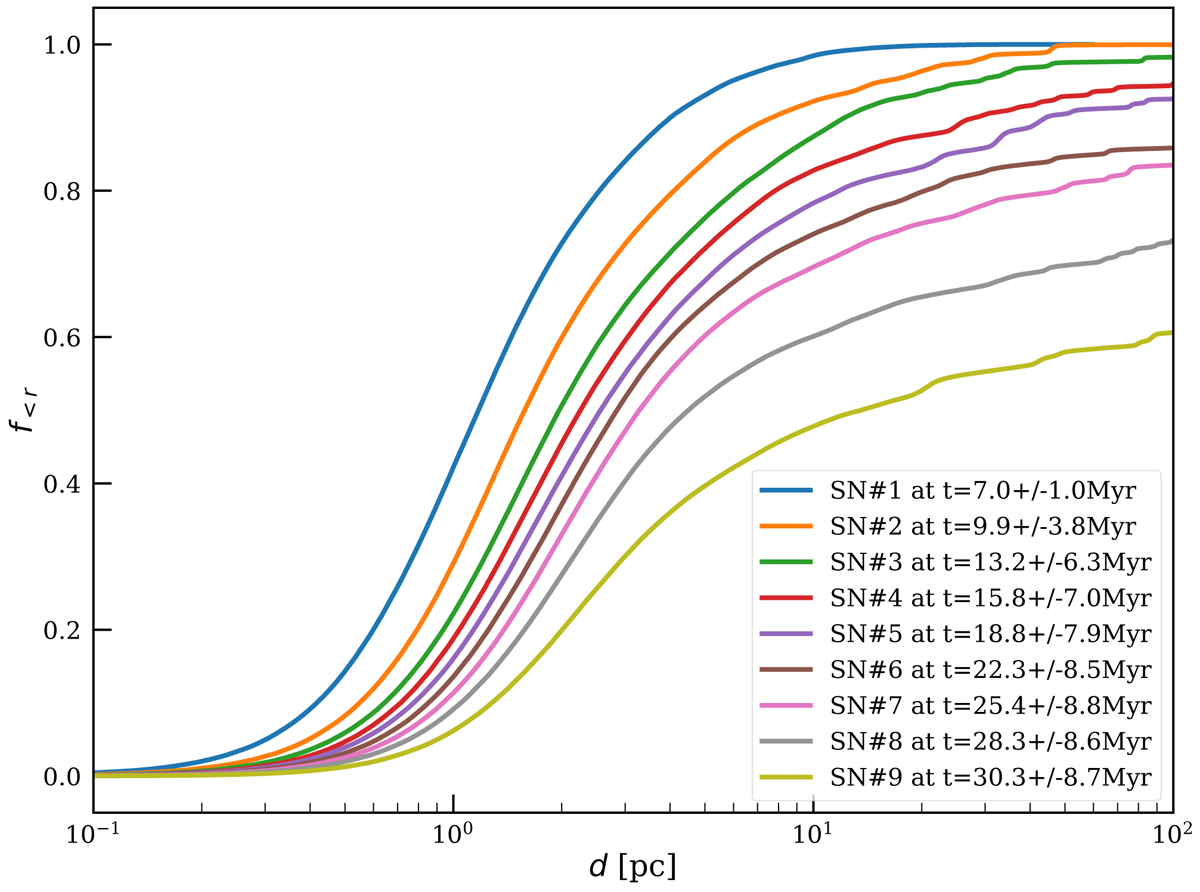
Cumulative distributions of the distance between an exploding star and the other stars in the cluster, separated in the order in which the supernovae occur and normalized to the number of runs. We only show the distance distribution for the first 9 supernovae, even though one run experienced as many as 17.
Current usage metrics show cumulative count of Article Views (full-text article views including HTML views, PDF and ePub downloads, according to the available data) and Abstracts Views on Vision4Press platform.
Data correspond to usage on the plateform after 2015. The current usage metrics is available 48-96 hours after online publication and is updated daily on week days.
Initial download of the metrics may take a while.