Fig. 6.
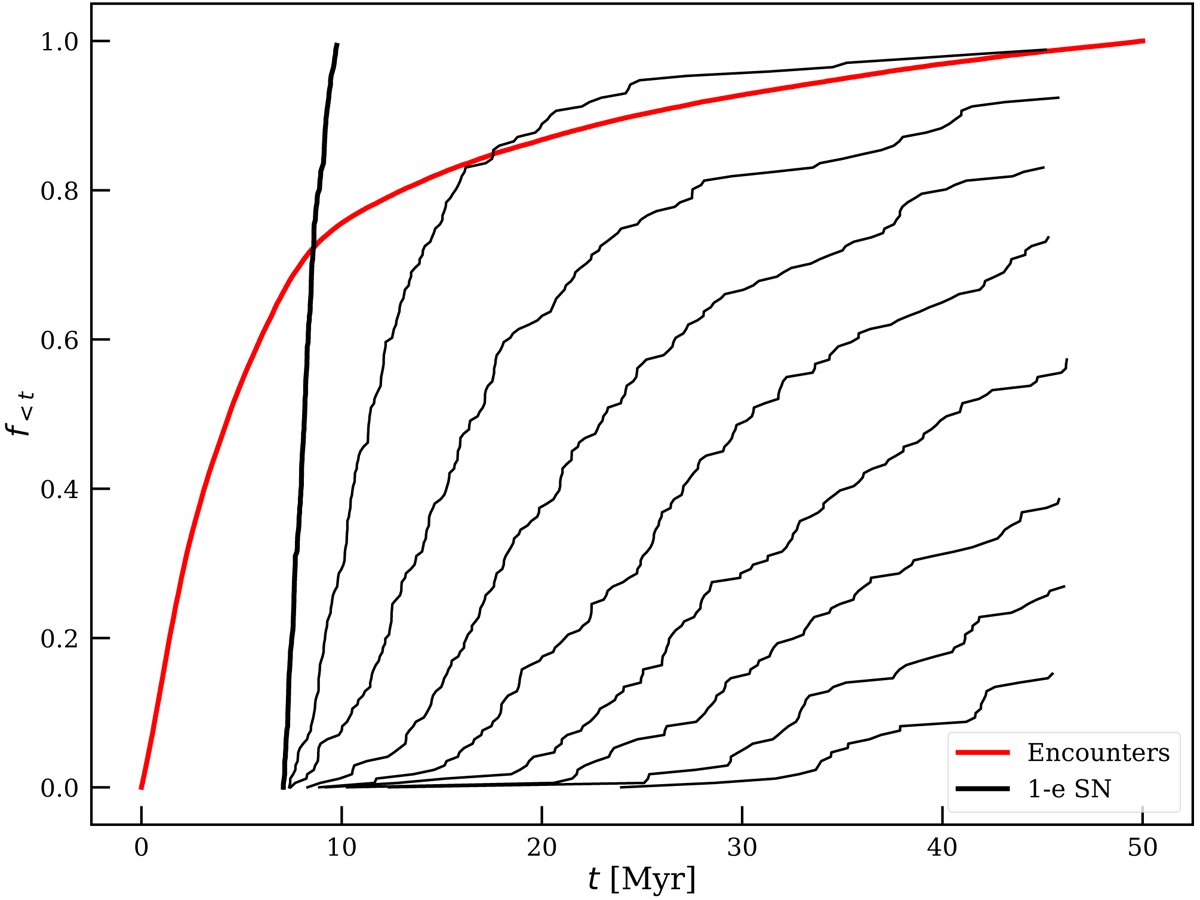
Cumulative distributions of the time of the strongest encounter (orange) and the moment of the first preserving supernova (blue) for the systems equivalent to the solar-system. We only plot the distributions for the first 9 supernovae from the 180 simulations with N = 2500 and rvir = 0.75 pc. A similar distribution of supernova distance was also presented in Parker et al. (2014).
Current usage metrics show cumulative count of Article Views (full-text article views including HTML views, PDF and ePub downloads, according to the available data) and Abstracts Views on Vision4Press platform.
Data correspond to usage on the plateform after 2015. The current usage metrics is available 48-96 hours after online publication and is updated daily on week days.
Initial download of the metrics may take a while.