Fig. 4.
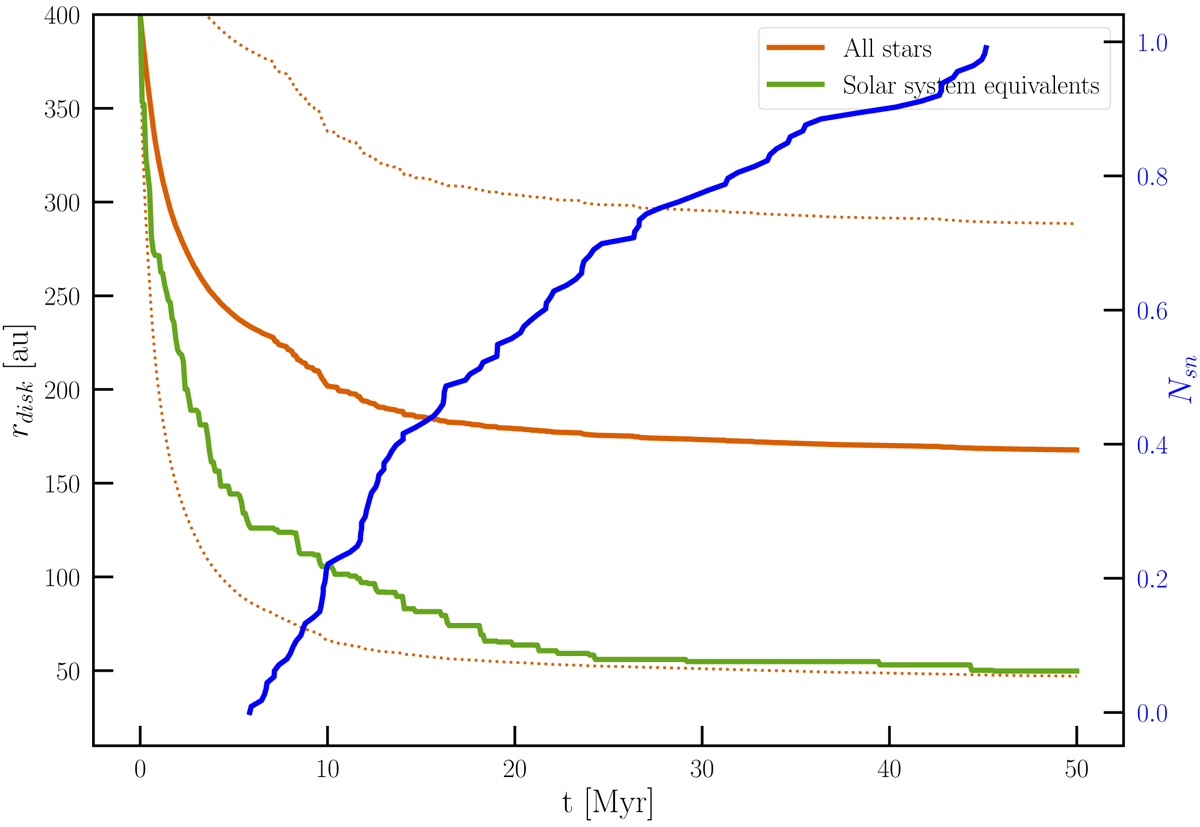
Time evolution of the mean disk size (thick orange curve) for all 180 simulations with N = 2500 and rvir = 0.75 pc. The two dotted orange curves give the standard deviation below and above the mean distribution of disk sizes. The green curve (below the orange curve) gives the evolution of mean disk size for stars with a high value of 𝒮sp. The blue curve (axis to the right, also in blue) gives the cumulative distribution of the number of supernovae in these simulations.
Current usage metrics show cumulative count of Article Views (full-text article views including HTML views, PDF and ePub downloads, according to the available data) and Abstracts Views on Vision4Press platform.
Data correspond to usage on the plateform after 2015. The current usage metrics is available 48-96 hours after online publication and is updated daily on week days.
Initial download of the metrics may take a while.