Fig. 10.
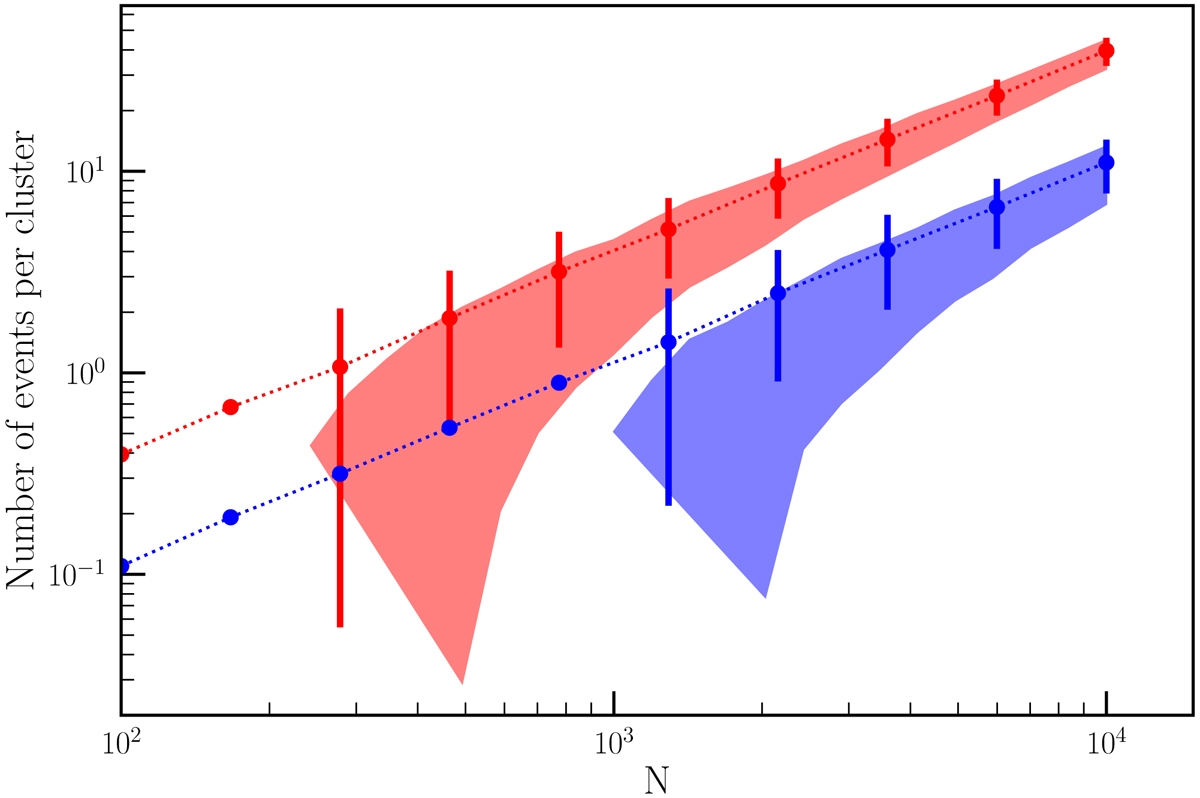
Expected number of Wolf-Rayet stars (blue) and supernovae (red) in a cluster as function of the number of stars. The red-shaded areas indicate the expectation range (one standard deviation around the mean) of stars sufficiently massive to experience a supernova for the broken power-law initial mass function with an upper mass-limit as provided by Eq. (2). The blue-shaded area gives the same statistics for the number of Wolf-Rayet stars. The dotted curves give the mean of the number of Wolf-Rayet stars (blue) and expected number of supernovae (red) for a mass-function with a fixed upper-limit of 120 M⊙.
Current usage metrics show cumulative count of Article Views (full-text article views including HTML views, PDF and ePub downloads, according to the available data) and Abstracts Views on Vision4Press platform.
Data correspond to usage on the plateform after 2015. The current usage metrics is available 48-96 hours after online publication and is updated daily on week days.
Initial download of the metrics may take a while.