Free Access
Fig. 5.
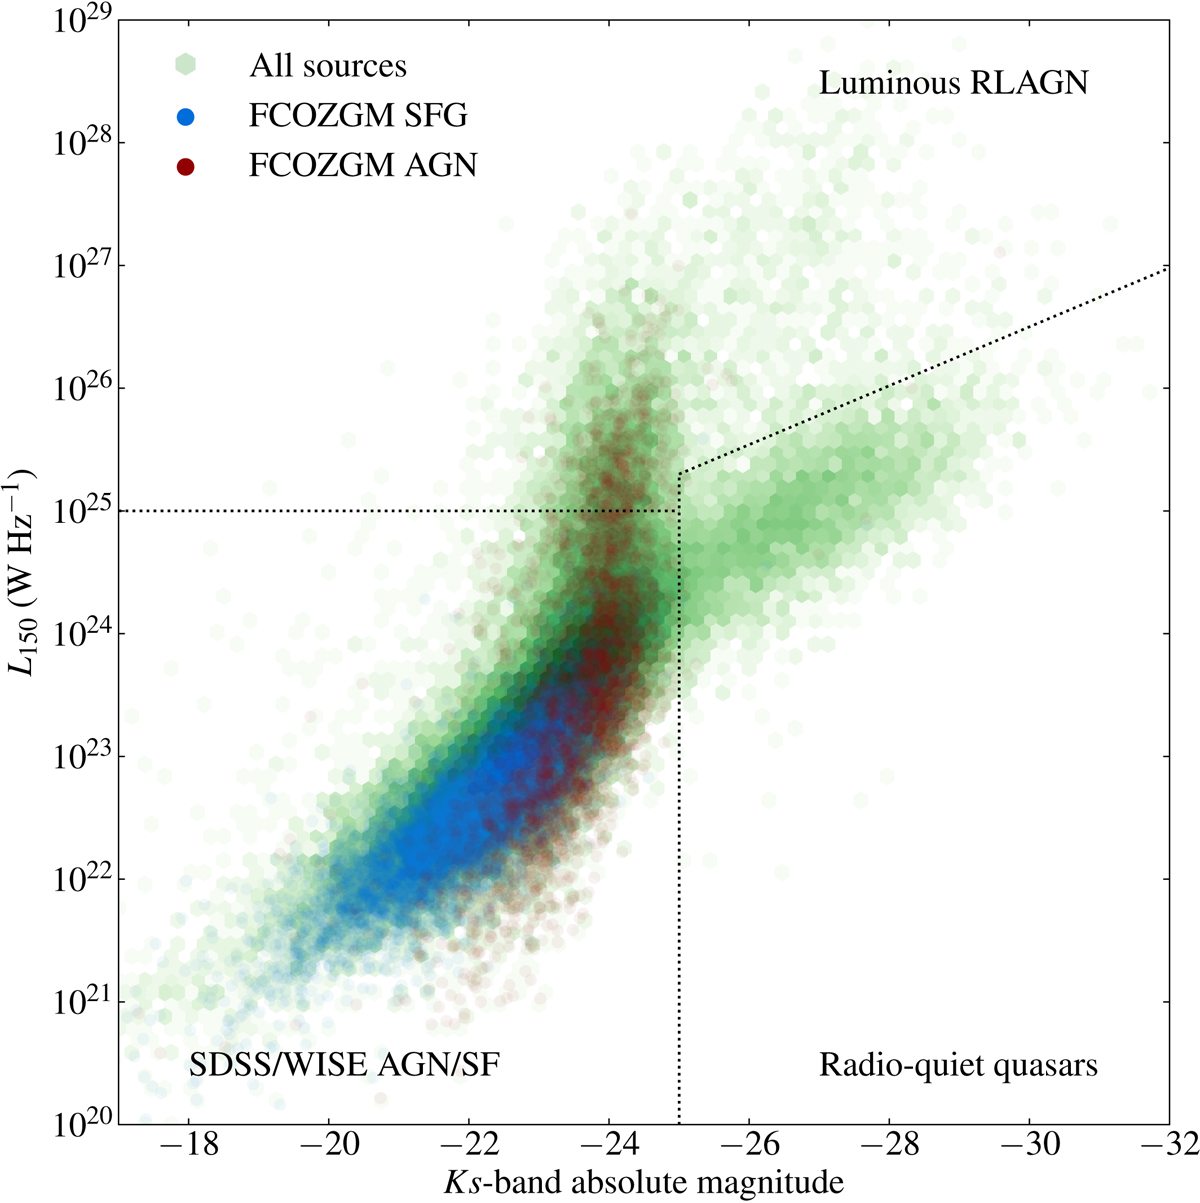
RLAGN and DDRGs in WISE colour–colour space. The hexagonal bins represent the density of RLAGN sources, while the orange scatter points represent the DDRGs
Current usage metrics show cumulative count of Article Views (full-text article views including HTML views, PDF and ePub downloads, according to the available data) and Abstracts Views on Vision4Press platform.
Data correspond to usage on the plateform after 2015. The current usage metrics is available 48-96 hours after online publication and is updated daily on week days.
Initial download of the metrics may take a while.