Fig. A.1.
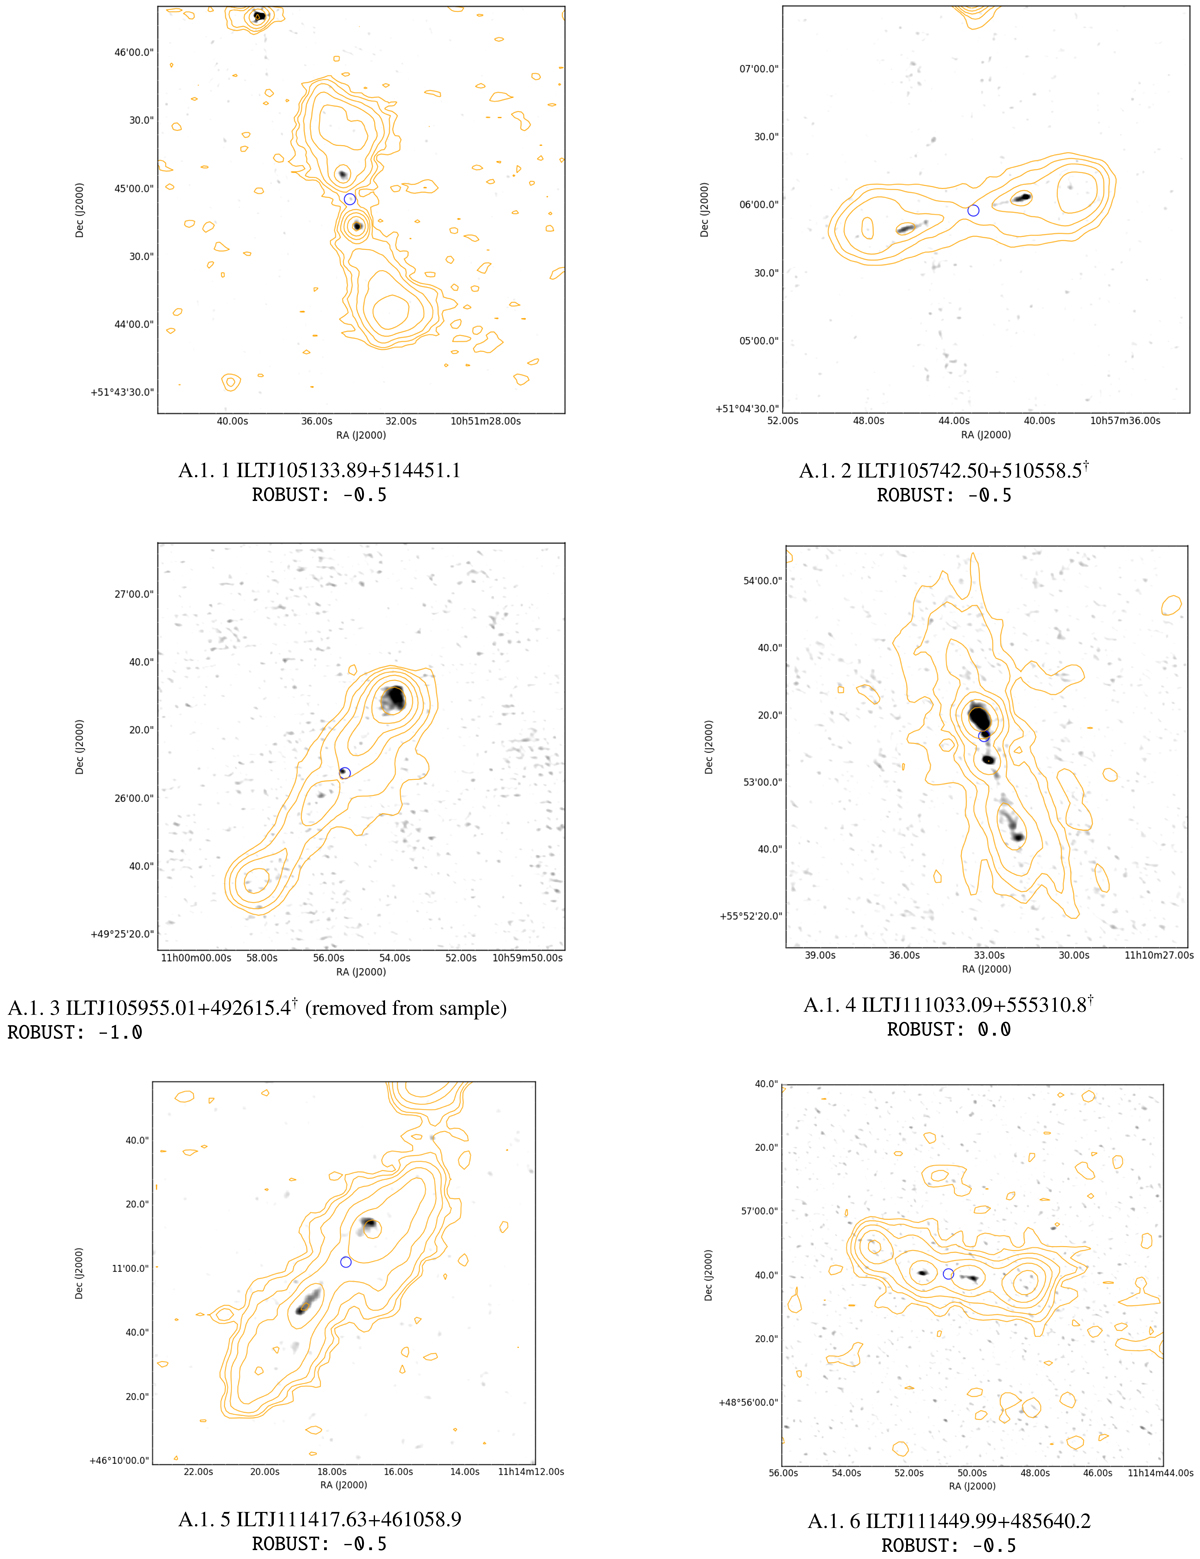
1.4 GHz VLA images of the 40 candidate restarted sources shown in greyscale, overlaid with the 144 MHz LOFAR contours from the LoTSS DR1 in orange. The VLA images are scaled logarithmically and smoothed with a Gaussian function with FWHM of 3 times the beam size. The LOFAR contours denote the surface brightness levels starting at 3σ and increasing at various powers of 3σ, where σ denotes the local RMS noise. †Owing to dynamic range limitations for the brightest sources, σ was instead chosen based on a particular value of the dynamic range in the LOFAR image, depending on the surface brightness of the source. The blue circles denote the optical ID. The source names in the sub-captions are the LOFAR source names presented in Table 1. The Briggs robust weighting parameters used for CLEANing the VLA images are labelled in the sub-captions.
Current usage metrics show cumulative count of Article Views (full-text article views including HTML views, PDF and ePub downloads, according to the available data) and Abstracts Views on Vision4Press platform.
Data correspond to usage on the plateform after 2015. The current usage metrics is available 48-96 hours after online publication and is updated daily on week days.
Initial download of the metrics may take a while.